The Power of PriceAction

What is Price Action?!
Price action is a trading methodology that analyzes the movement of an asset’s price over time to make trading decisions. It is the foundation of technical analysis and operates on the principle that all relevant market information—including economic news, investor sentiment, and fundamental data—is already reflected in the asset’s price.
Instead of relying on lagging technical indicators, traders who use price action focus on a “naked” or clean chart. By observing historical price data, they identify patterns, trends, and key levels to predict future price direction.The core concepts of price action analysis include:Support and Resistance
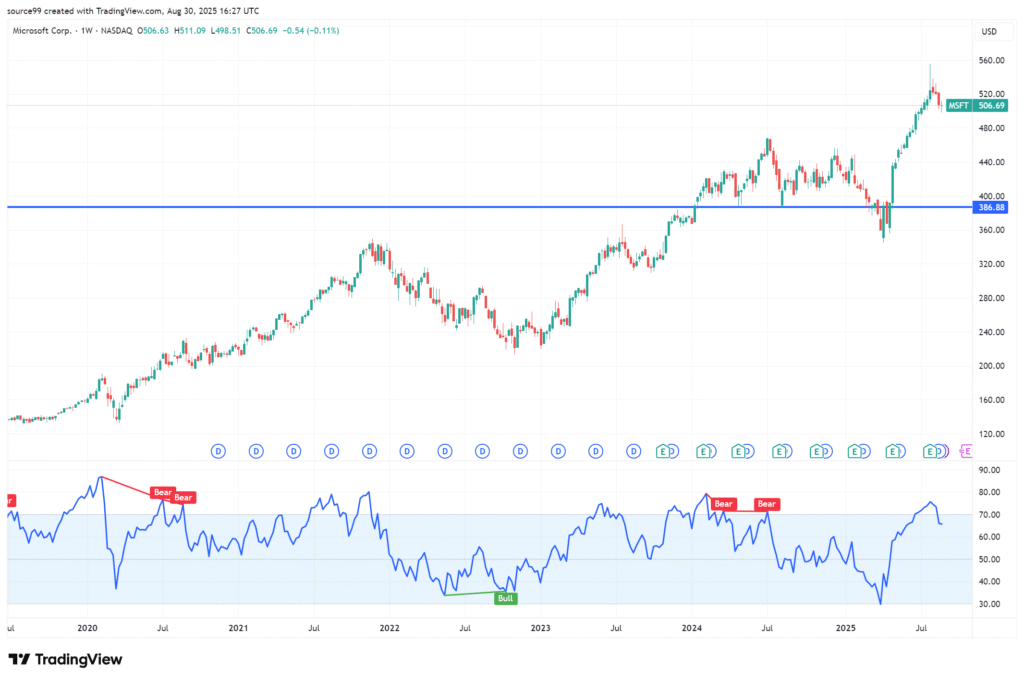
These are price levels where an asset’s price has historically paused or reversed direction. A support level is a price floor where buying pressure is strong enough to prevent the price from falling further. A resistance level is a price ceiling where selling pressure is sufficient to stop the price from rising higher.
Candlestick Patterns
Candlestick charts are a primary tool for price action traders. Each candlestick represents a specific period and shows the open, high, low, and closing prices. The shape and color of the candlesticks form patterns (e.g., Doji, Hammer, Engulfing) that provide insights into market sentiment and can signal potential reversals or continuations.
Trend Analysis
Price action traders identify the market’s trend by observing the sequence of highs and lows. An uptrend is characterized by a series of higher highs and higher lows, while a downtrend is marked by lower highs and lower lows. A break in this sequence can indicate a potential trend reversal.
💰Quotes:
“Price action is the only truth on the chart.”
“Everything you need to know is written in the candles.”
“Indicators lag, price action leads.”
“Trade what you see, not what you think.”
“Every candle tells a story. Learn to read it.”

💰Quotes:
“Support and resistance are the footprints of money.”
“A closed candle is a fact, an open candle is only a possibility.”
“The market doesn’t hide; it leaves clues in price action.”
“The best trades look obvious… after you’ve learned to see them.”
“Patterns are just human emotions drawn on a chart.”

The Power of PriceAction

What is Price Action?!
Ah, Price Action—it sounds like an intense, government-sanctioned initiative, but in trading, it’s far simpler, yet utterly essential.
What is Price Action?
“Price Action” is the dignified term for reading the raw movement of a security’s price over time, typically displayed on a clean candlestick chart. It’s the art of observing the market without the clutter of those fancy, often lagging, mathematical indicators like MACD or RSI. We call it “naked trading,” which is less scandalous than it sounds, mostly just meaning your chart is indicator-free and minimalist.
Think of it this way: instead of consulting ten different market “oracles” (indicators) that are all looking backward, a price action trader is looking directly at the market’s face, reading its body language. Is that a strong, decisive “bullish engulfing” candle? Or is it a shifty little “Doji” suggesting indecision, like a CEO trying to decide between two identical shades of beige for the boardroom?
The core fundamental is that all available information—from a surprise inflation report to a sudden urge by a whale to buy a million shares—is already baked into the price. By analyzing patterns, support and resistance levels (the market’s floor and ceiling), and the size and shape of the candles, the professional price action trader aims to anticipate the market’s next move without all the digital noise. It’s about letting the market speak for itself.
💰Quotes:
“Price action is the only truth on the chart.”
“Everything you need to know is written in the candles.”
“Indicators lag, price action leads.”
“Trade what you see, not what you think.”
“Every candle tells a story. Learn to read it.”

💰Quotes:
“Support and resistance are the footprints of money.”
“A closed candle is a fact, an open candle is only a possibility.”
“The market doesn’t hide; it leaves clues in price action.”
“The best trades look obvious… after you’ve learned to see them.”
“Patterns are just human emotions drawn on a chart.”

The Power of PriceAction

What is Price Action?!
Ah, Price Action—it sounds like a secret division of the Federal Reserve, but in the trading world, it’s actually just the most direct way to look at the market. At its core, price action is the discipline of making trading decisions purely by observing the movement of an asset’s price on a chart, stripped bare of distracting technical indicators. It’s the trading equivalent of saying, “Just tell me what the price is doing right now; I don’t need a math lecture about the average of the last 14 days!”
The Naked Truth of the Chart
Imagine your typical trading screen, plastered with a dozen multi-colored squiggly lines like an abstract expressionist painting gone horribly wrong. That’s what happens when you overload it with complex indicators like the stochastic oscillator or the Bollinger Bands. A price action trader, by contrast, embraces a minimalist aesthetic. They believe that all the information you need—every bit of fundamental news, every rumor, every fear, and every surge of greed—is already perfectly reflected in the price itself. Why consult a mathematical derivative of the price when you can look at the source data? It’s like reading the weather report by stepping outside instead of running a complex atmospheric simulation that’s perpetually three hours behind.
The primary tool for this practice is the candlestick chart. Each little candle isn’t just a bar; it’s a detailed report on a tiny, decisive battle between the buyers (bulls) and the sellers (bears) over a specific period. By analyzing the shape of the candle, its body size, and the length of its wicks (shadows), you can deduce the market’s psychology—which, let’s be honest, is often pure chaos dressed up in a financial suit:
A long wick might indicate a sharp rejection of a certain price level, like a stubborn bouncer throwing out unruly partygoers who tried to push past a specific dollar amount.
A big, chunky green body shows the bulls won that round decisively, spiking the price like they just chugged five energy drinks.
A Doji (a candle with almost no body) is the ultimate picture of market indecision, where buyers and sellers fought to a standstill and both sides just slumped off to get a coffee.
Reading the Market’s Body Language
Price action moves beyond single candles to analyze structural patterns. Traders look for areas of Support and Resistance—the market’s psychological floors and ceilings where prices repeatedly bounce. The real skill lies in watching how the price approaches these levels. Does it hit the “ceiling” with a meek little tap, suggesting it’s tired and about to collapse like a cheap tent? Or does it smash into it with large, aggressive candles, signaling a breakout is imminent, meaning the price is finally done with the old neighborhood?
This approach avoids the notorious “lag” that plagues indicator-heavy systems. Since those are calculations based on past data, they are inherently late to the party. Price action, however, is real-time. It’s direct observation, giving the trader a subjective, high-probability clue about where the market is going next. It’s the difference between reading a rumor about a fight that happened ten minutes ago and watching the actual fists fly. In essence, price action is the quest to find a profitable pattern in the glorious, relentless, and occasionally unhinged chaos of market movement.
💰Quotes:
“Price action is the only truth on the chart.”
“Everything you need to know is written in the candles.”
“Indicators lag, price action leads.”
“Trade what you see, not what you think.”
“Every candle tells a story. Learn to read it.”

💰Quotes:
“Support and resistance are the footprints of money.”
“A closed candle is a fact, an open candle is only a possibility.”
“The market doesn’t hide; it leaves clues in price action.”
“The best trades look obvious… after you’ve learned to see them.”
“Patterns are just human emotions drawn on a chart.”

