Charts

Price Action Charts

Lorem ipsum dolor sit amet, consectetur adipiscing elit. Ut elit tellus, luctus nec ullamcorper mattis, pulvinar dapibus leo.
Lorem ipsum dolor sit amet, consectetur adipiscing elit. Ut elit tellus, luctus nec ullamcorper mattis, pulvinar dapibus leo.

- Is the current trend bullish or bearish?
2. Is the main trend bullish or bearish on selected timeframe?
3. Where is price now? where are the keylevels?
4. Are there any Price Action?
5. Are there any failed Price Action?
6. Is there evidence that the market is getting rid of buyers or sellers?
💰“The Power of Price Action”
Quotes:
“Let Price Tell the Story.”
“Price Never Lies – Everything Else Might.”
“Trade What You See, Not What You Think.”
“Candles Speak Louder Than Indicators.”
- “The Truth is in the Candles.”
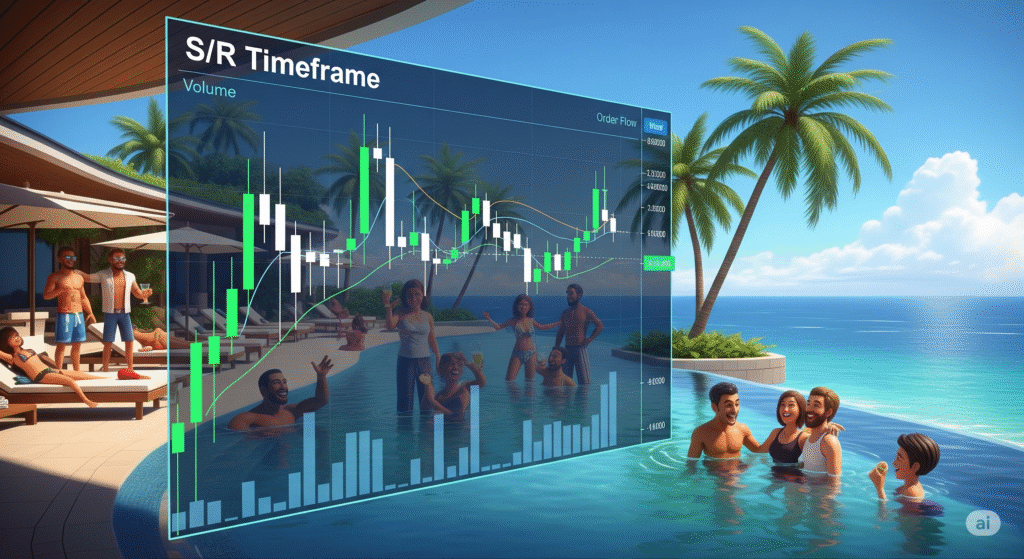
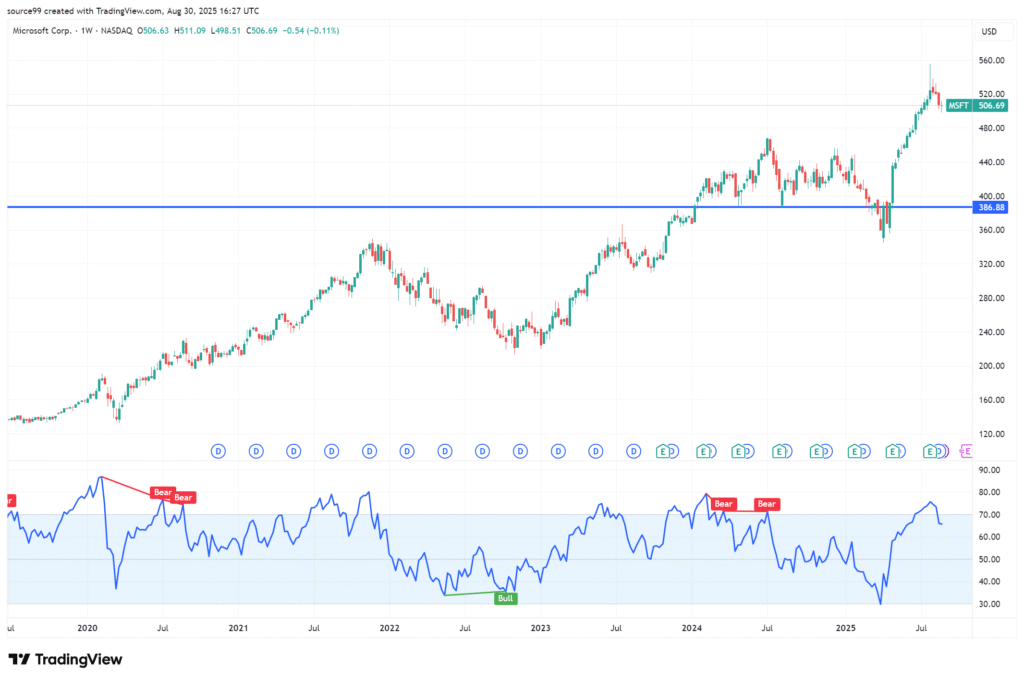
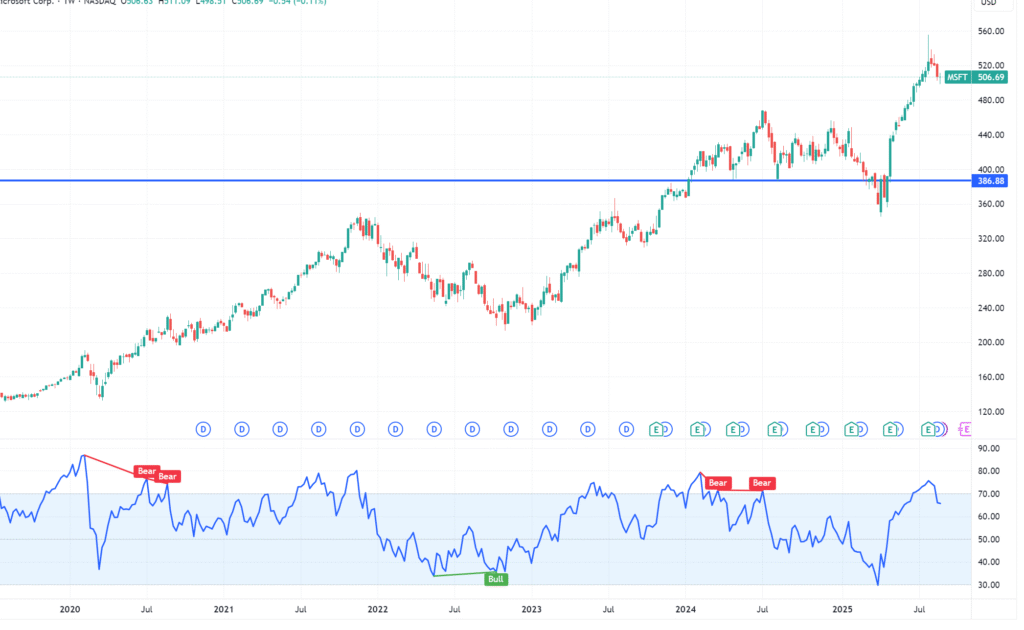
Price action trading charts involve the analysis of raw price movement displayed directly on a chart, typically using candlesticks or bars. This method prioritizes the visual interpretation of how buyers and sellers are interacting, without the immediate reliance on secondary indicators.
By observing patterns in price highs, lows, opens, and closes, traders aim to understand market psychology, identify key support and resistance levels, and discern potential trends or reversals. It’s a direct approach to market analysis, where the price itself is considered the most comprehensive and reliable source of information for making trading decisions.

Forex
Ever stare at a bunch of flickering numbers and think, “There has to be a better way to understand this chaos?” Well, my friend, say hello to Trading Charts!
These aren’t just fancy graphs; they’re the market’s own reality show, condensed into a visual story. Each bar or candlestick is a tiny drama playing out, showing you exactly where the price opened, closed, and briefly went crazy, all over a specific period.
Think of it as your personal decoder ring for the financial world. Instead of trying to guess what’s happening, you’re literally seeing the market’s past behavior laid out before you. Are prices skyrocketing like a cat on a trampoline? Or are they plummeting like a lead balloon? Your chart tells all!
So, grab your popcorn. By learning to read these visual diaries, you’ll start spotting patterns, understanding the market’s moods, and maybe even predicting its next dramatic plot twist. It’s less guesswork, more “aha!” moments.
Add Your Heading

Lorem ipsum dolor sit amet, consectetur adipiscing elit. Ut elit tellus, luctus nec ullamcorper mattis, pulvinar dapibus leo.
Lorem ipsum dolor sit amet, consectetur adipiscing elit. Ut elit tellus, luctus nec ullamcorper mattis, pulvinar dapibus leo.
Metal
Ever stare at a bunch of flickering numbers and think, “There has to be a better way to understand this chaos?” Well, my friend, say hello to Trading Charts!
These aren’t just fancy graphs; they’re the market’s own reality show, condensed into a visual story. Each bar or candlestick is a tiny drama playing out, showing you exactly where the price opened, closed, and briefly went crazy, all over a specific period.
Think of it as your personal decoder ring for the financial world. Instead of trying to guess what’s happening, you’re literally seeing the market’s past behavior laid out before you. Are prices skyrocketing like a cat on a trampoline? Or are they plummeting like a lead balloon? Your chart tells all!
So, grab your popcorn. By learning to read these visual diaries, you’ll start spotting patterns, understanding the market’s moods, and maybe even predicting its next dramatic plot twist. It’s less guesswork, more “aha!” moments.
Add Your Heading

Crypto
Ever stare at a bunch of flickering numbers and think, “There has to be a better way to understand this chaos?” Well, my friend, say hello to Trading Charts!
These aren’t just fancy graphs; they’re the market’s own reality show, condensed into a visual story. Each bar or candlestick is a tiny drama playing out, showing you exactly where the price opened, closed, and briefly went crazy, all over a specific period.
Think of it as your personal decoder ring for the financial world. Instead of trying to guess what’s happening, you’re literally seeing the market’s past behavior laid out before you. Are prices skyrocketing like a cat on a trampoline? Or are they plummeting like a lead balloon? Your chart tells all!
So, grab your popcorn. By learning to read these visual diaries, you’ll start spotting patterns, understanding the market’s moods, and maybe even predicting its next dramatic plot twist. It’s less guesswork, more “aha!” moments.
Add Your Heading

Stocks
Ever stare at a bunch of flickering numbers and think, “There has to be a better way to understand this chaos?” Well, my friend, say hello to Trading Charts!
These aren’t just fancy graphs; they’re the market’s own reality show, condensed into a visual story. Each bar or candlestick is a tiny drama playing out, showing you exactly where the price opened, closed, and briefly went crazy, all over a specific period.
Think of it as your personal decoder ring for the financial world. Instead of trying to guess what’s happening, you’re literally seeing the market’s past behavior laid out before you. Are prices skyrocketing like a cat on a trampoline? Or are they plummeting like a lead balloon? Your chart tells all!
So, grab your popcorn. By learning to read these visual diaries, you’ll start spotting patterns, understanding the market’s moods, and maybe even predicting its next dramatic plot twist. It’s less guesswork, more “aha!” moments.
Add Your Heading

Sgd/Jpy
Inside Bar

Crypto Chart

Lorem ipsum dolor sit amet, consectetur adipiscing elit. Ut elit tellus, luctus nec ullamcorper mattis, pulvinar dapibus leo.
Forex Chart

Lorem ipsum dolor sit amet, consectetur adipiscing elit. Ut elit tellus, luctus nec ullamcorper mattis, pulvinar dapibus leo.
Stock Chart

Lorem ipsum dolor sit amet, consectetur adipiscing elit. Ut elit tellus, luctus nec ullamcorper mattis, pulvinar dapibus leo.
Metal Chart

Lorem ipsum dolor sit amet, consectetur adipiscing elit. Ut elit tellus, luctus nec ullamcorper mattis, pulvinar dapibus leo.
Sgd/Jpy

Lorem ipsum dolor sit amet, consectetur adipiscing elit. Ut elit tellus, luctus nec ullamcorper mattis, pulvinar dapibus leo.
Inside Bar

Lorem ipsum dolor sit amet, consectetur adipiscing elit. Ut elit tellus, luctus nec ullamcorper mattis, pulvinar dapibus leo.
Inside Bar

Lorem ipsum dolor sit amet, consectetur adipiscing elit. Ut elit tellus, luctus nec ullamcorper mattis, pulvinar dapibus leo.
Swing Trading

💰
“Enter the trade — then sit on your hands like a monk!”
“We don’t click and panic. We click and chill.”
“Traders who wait, get paid. Traders who fidget… donate!”
“We enter the trade, then do absolutely nothing like pros.”
“Let the market work. You’re not its boss.”
Lorem ipsum dolor sit amet, consectetur adipiscing elit. Ut elit tellus, luctus nec ullamcorper mattis, pulvinar dapibus leo.
💰
“Enter the trade — then sit on your hands like a monk!”
“We don’t click and panic. We click and chill.”
“Traders who wait, get paid. Traders who fidget… donate!”
“We enter the trade, then do absolutely nothing like pros.”
“Let the market work. You’re not its boss.”
💰
“Enter the trade — then sit on your hands like a monk!”
“We don’t click and panic. We click and chill.”
“Traders who wait, get paid. Traders who fidget… donate!”
“We enter the trade, then do absolutely nothing like pros.”
“Let the market work. You’re not its boss.”
💰
“Enter the trade — then sit on your hands like a monk!”
“We don’t click and panic. We click and chill.”
“Traders who wait, get paid. Traders who fidget… donate!”
“We enter the trade, then do absolutely nothing like pros.”
“Let the market work. You’re not its boss.”
Forex
💰
“Enter the trade — then sit on your hands like a monk!”
“We don’t click and panic. We click and chill.”
“Traders who wait, get paid. Traders who fidget… donate!”
“We enter the trade, then do absolutely nothing like pros.”
“Let the market work. You’re not its boss.”
Lorem ipsum dolor sit amet, consectetur adipiscing elit. Ut elit tellus, luctus nec ullamcorper mattis, pulvinar dapibus leo.
Stocks
💰
“Enter the trade — then sit on your hands like a monk!”
“We don’t click and panic. We click and chill.”
“Traders who wait, get paid. Traders who fidget… donate!”
“We enter the trade, then do absolutely nothing like pros.”
“Let the market work. You’re not its boss.”
Lorem ipsum dolor sit amet, consectetur adipiscing elit. Ut elit tellus, luctus nec ullamcorper mattis, pulvinar dapibus leo.
Crypto
💰
“Enter the trade — then sit on your hands like a monk!”
“We don’t click and panic. We click and chill.”
“Traders who wait, get paid. Traders who fidget… donate!”
“We enter the trade, then do absolutely nothing like pros.”
“Let the market work. You’re not its boss.”
Lorem ipsum dolor sit amet, consectetur adipiscing elit. Ut elit tellus, luctus nec ullamcorper mattis, pulvinar dapibus leo.
Metal
💰
“Enter the trade — then sit on your hands like a monk!”
“We don’t click and panic. We click and chill.”
“Traders who wait, get paid. Traders who fidget… donate!”
“We enter the trade, then do absolutely nothing like pros.”
“Let the market work. You’re not its boss.”
Lorem ipsum dolor sit amet, consectetur adipiscing elit. Ut elit tellus, luctus nec ullamcorper mattis, pulvinar dapibus leo.
💰
Price action is the foundation of technical trading. It refers to the movement of price over time, without relying on indicators. Here’s why it’s powerful:
🔥 The Power of Price Action:
Simplicity
Price action strips away distractions. Traders read candles, structure, and key levels directly from the chart.Real-Time Clarity
It reflects real-time decisions of buyers and sellers, showing where the market is reacting.Universal Application
Works on all timeframes and markets—forex, stocks, crypto.Identifies Key Setups
Patterns like:Pin bars
Engulfing candles
Inside bars
Break and retest
provide high-probability entries.
Institutional Footprints
Price action helps you “see” what smart money is doing—entries at key levels, liquidity grabs, false breaks, etc.No Lag
Unlike indicators, it’s immediate—based on what’s happening now, not 10 bars ago.
Price Action Charts

- Is the current trend bullish or bearish?
2. Is the main trend bullish or bearish on selected timeframe?
3. Where is price now? where are the keylevels?
4. Are there any Price Action?
5. Are there any failed Price Action?
6. Is there evidence that the market is getting rid of buyers or sellers?
💰“The Power of Price Action”
Quotes:
“Let Price Tell the Story.”
“Price Never Lies – Everything Else Might.”
“Trade What You See, Not What You Think.”
“Candles Speak Louder Than Indicators.”
- “The Truth is in the Candles.”
Crypto Chart

Forex Chart

Stock Chart

Metal Chart

Lorem ipsum dolor sit amet, consectetur adipiscing elit. Ut elit tellus, luctus nec ullamcorper mattis, pulvinar dapibus leo.
Lorem ipsum dolor sit amet, consectetur adipiscing elit. Ut elit tellus, luctus nec ullamcorper mattis, pulvinar dapibus leo.
Lorem ipsum dolor sit amet, consectetur adipiscing elit. Ut elit tellus, luctus nec ullamcorper mattis, pulvinar dapibus leo.
Lorem ipsum dolor sit amet, consectetur adipiscing elit. Ut elit tellus, luctus nec ullamcorper mattis, pulvinar dapibus leo.