Charts
Price Action Charts
Lorem ipsum dolor sit amet, consectetur adipiscing elit. Ut elit tellus, luctus nec ullamcorper mattis, pulvinar dapibus leo.
Lorem ipsum dolor sit amet, consectetur adipiscing elit. Ut elit tellus, luctus nec ullamcorper mattis, pulvinar dapibus leo.

- Is the current trend bullish or bearish?
2. Is the main trend bullish or bearish on selected timeframe?
3. Where is price now? where are the keylevels?
4. Are there any Price Action?
5. Are there any failed Price Action?
6. Is there evidence that the market is getting rid of buyers or sellers?
💰“The Power of Price Action”
Quotes:
“Let Price Tell the Story.”
“Price Never Lies – Everything Else Might.”
“Trade What You See, Not What You Think.”
“Candles Speak Louder Than Indicators.”
- “The Truth is in the Candles.”
Price action trading charts involve the analysis of raw price movement displayed directly on a chart, typically using candlesticks or bars. This method prioritizes the visual interpretation of how buyers and sellers are interacting, without the immediate reliance on secondary indicators.
By observing patterns in price highs, lows, opens, and closes, traders aim to understand market psychology, identify key support and resistance levels, and discern potential trends or reversals. It’s a direct approach to market analysis, where the price itself is considered the most comprehensive and reliable source of information for making trading decisions.

Forex
Ever stare at a bunch of flickering numbers and think, “There has to be a better way to understand this chaos?” Well, my friend, say hello to Trading Charts!
These aren’t just fancy graphs; they’re the market’s own reality show, condensed into a visual story. Each bar or candlestick is a tiny drama playing out, showing you exactly where the price opened, closed, and briefly went crazy, all over a specific period.
Think of it as your personal decoder ring for the financial world. Instead of trying to guess what’s happening, you’re literally seeing the market’s past behavior laid out before you. Are prices skyrocketing like a cat on a trampoline? Or are they plummeting like a lead balloon? Your chart tells all!
So, grab your popcorn. By learning to read these visual diaries, you’ll start spotting patterns, understanding the market’s moods, and maybe even predicting its next dramatic plot twist. It’s less guesswork, more “aha!” moments.
Add Your Heading
Lorem ipsum dolor sit amet, consectetur adipiscing elit. Ut elit tellus, luctus nec ullamcorper mattis, pulvinar dapibus leo.
Lorem ipsum dolor sit amet, consectetur adipiscing elit. Ut elit tellus, luctus nec ullamcorper mattis, pulvinar dapibus leo.
Metal
Ever stare at a bunch of flickering numbers and think, “There has to be a better way to understand this chaos?” Well, my friend, say hello to Trading Charts!
These aren’t just fancy graphs; they’re the market’s own reality show, condensed into a visual story. Each bar or candlestick is a tiny drama playing out, showing you exactly where the price opened, closed, and briefly went crazy, all over a specific period.
Think of it as your personal decoder ring for the financial world. Instead of trying to guess what’s happening, you’re literally seeing the market’s past behavior laid out before you. Are prices skyrocketing like a cat on a trampoline? Or are they plummeting like a lead balloon? Your chart tells all!
So, grab your popcorn. By learning to read these visual diaries, you’ll start spotting patterns, understanding the market’s moods, and maybe even predicting its next dramatic plot twist. It’s less guesswork, more “aha!” moments.
Add Your Heading
Crypto
Ever stare at a bunch of flickering numbers and think, “There has to be a better way to understand this chaos?” Well, my friend, say hello to Trading Charts!
These aren’t just fancy graphs; they’re the market’s own reality show, condensed into a visual story. Each bar or candlestick is a tiny drama playing out, showing you exactly where the price opened, closed, and briefly went crazy, all over a specific period.
Think of it as your personal decoder ring for the financial world. Instead of trying to guess what’s happening, you’re literally seeing the market’s past behavior laid out before you. Are prices skyrocketing like a cat on a trampoline? Or are they plummeting like a lead balloon? Your chart tells all!
So, grab your popcorn. By learning to read these visual diaries, you’ll start spotting patterns, understanding the market’s moods, and maybe even predicting its next dramatic plot twist. It’s less guesswork, more “aha!” moments.
Add Your Heading
Stocks
Ever stare at a bunch of flickering numbers and think, “There has to be a better way to understand this chaos?” Well, my friend, say hello to Trading Charts!
These aren’t just fancy graphs; they’re the market’s own reality show, condensed into a visual story. Each bar or candlestick is a tiny drama playing out, showing you exactly where the price opened, closed, and briefly went crazy, all over a specific period.
Think of it as your personal decoder ring for the financial world. Instead of trying to guess what’s happening, you’re literally seeing the market’s past behavior laid out before you. Are prices skyrocketing like a cat on a trampoline? Or are they plummeting like a lead balloon? Your chart tells all!
So, grab your popcorn. By learning to read these visual diaries, you’ll start spotting patterns, understanding the market’s moods, and maybe even predicting its next dramatic plot twist. It’s less guesswork, more “aha!” moments.
Add Your Heading
Sgd/Jpy
Inside Bar
Crypto Chart
Lorem ipsum dolor sit amet, consectetur adipiscing elit. Ut elit tellus, luctus nec ullamcorper mattis, pulvinar dapibus leo.
Forex Chart
Lorem ipsum dolor sit amet, consectetur adipiscing elit. Ut elit tellus, luctus nec ullamcorper mattis, pulvinar dapibus leo.
Stock Chart
Lorem ipsum dolor sit amet, consectetur adipiscing elit. Ut elit tellus, luctus nec ullamcorper mattis, pulvinar dapibus leo.
Metal Chart
Lorem ipsum dolor sit amet, consectetur adipiscing elit. Ut elit tellus, luctus nec ullamcorper mattis, pulvinar dapibus leo.
Sgd/Jpy
Lorem ipsum dolor sit amet, consectetur adipiscing elit. Ut elit tellus, luctus nec ullamcorper mattis, pulvinar dapibus leo.
Inside Bar
Lorem ipsum dolor sit amet, consectetur adipiscing elit. Ut elit tellus, luctus nec ullamcorper mattis, pulvinar dapibus leo.
Inside Bar
Lorem ipsum dolor sit amet, consectetur adipiscing elit. Ut elit tellus, luctus nec ullamcorper mattis, pulvinar dapibus leo.
Swing Trading
💰
“Enter the trade — then sit on your hands like a monk!”
“We don’t click and panic. We click and chill.”
“Traders who wait, get paid. Traders who fidget… donate!”
“We enter the trade, then do absolutely nothing like pros.”
“Let the market work. You’re not its boss.”
Lorem ipsum dolor sit amet, consectetur adipiscing elit. Ut elit tellus, luctus nec ullamcorper mattis, pulvinar dapibus leo.
💰
“Enter the trade — then sit on your hands like a monk!”
“We don’t click and panic. We click and chill.”
“Traders who wait, get paid. Traders who fidget… donate!”
“We enter the trade, then do absolutely nothing like pros.”
“Let the market work. You’re not its boss.”
💰
“Enter the trade — then sit on your hands like a monk!”
“We don’t click and panic. We click and chill.”
“Traders who wait, get paid. Traders who fidget… donate!”
“We enter the trade, then do absolutely nothing like pros.”
“Let the market work. You’re not its boss.”
💰
“Enter the trade — then sit on your hands like a monk!”
“We don’t click and panic. We click and chill.”
“Traders who wait, get paid. Traders who fidget… donate!”
“We enter the trade, then do absolutely nothing like pros.”
“Let the market work. You’re not its boss.”
Forex
💰
“Enter the trade — then sit on your hands like a monk!”
“We don’t click and panic. We click and chill.”
“Traders who wait, get paid. Traders who fidget… donate!”
“We enter the trade, then do absolutely nothing like pros.”
“Let the market work. You’re not its boss.”
Lorem ipsum dolor sit amet, consectetur adipiscing elit. Ut elit tellus, luctus nec ullamcorper mattis, pulvinar dapibus leo.
Stocks
💰
“Enter the trade — then sit on your hands like a monk!”
“We don’t click and panic. We click and chill.”
“Traders who wait, get paid. Traders who fidget… donate!”
“We enter the trade, then do absolutely nothing like pros.”
“Let the market work. You’re not its boss.”
Lorem ipsum dolor sit amet, consectetur adipiscing elit. Ut elit tellus, luctus nec ullamcorper mattis, pulvinar dapibus leo.
Crypto
💰
“Enter the trade — then sit on your hands like a monk!”
“We don’t click and panic. We click and chill.”
“Traders who wait, get paid. Traders who fidget… donate!”
“We enter the trade, then do absolutely nothing like pros.”
“Let the market work. You’re not its boss.”
Lorem ipsum dolor sit amet, consectetur adipiscing elit. Ut elit tellus, luctus nec ullamcorper mattis, pulvinar dapibus leo.
Metal
💰
“Enter the trade — then sit on your hands like a monk!”
“We don’t click and panic. We click and chill.”
“Traders who wait, get paid. Traders who fidget… donate!”
“We enter the trade, then do absolutely nothing like pros.”
“Let the market work. You’re not its boss.”
Lorem ipsum dolor sit amet, consectetur adipiscing elit. Ut elit tellus, luctus nec ullamcorper mattis, pulvinar dapibus leo.
💰
Price action is the foundation of technical trading. It refers to the movement of price over time, without relying on indicators. Here’s why it’s powerful:
🔥 The Power of Price Action:
Simplicity
Price action strips away distractions. Traders read candles, structure, and key levels directly from the chart.Real-Time Clarity
It reflects real-time decisions of buyers and sellers, showing where the market is reacting.Universal Application
Works on all timeframes and markets—forex, stocks, crypto.Identifies Key Setups
Patterns like:Pin bars
Engulfing candles
Inside bars
Break and retest
provide high-probability entries.
Institutional Footprints
Price action helps you “see” what smart money is doing—entries at key levels, liquidity grabs, false breaks, etc.No Lag
Unlike indicators, it’s immediate—based on what’s happening now, not 10 bars ago.
Price Action Charts
- Is the current trend bullish or bearish?
2. Is the main trend bullish or bearish on selected timeframe?
3. Where is price now? where are the keylevels?
4. Are there any Price Action?
5. Are there any failed Price Action?
6. Is there evidence that the market is getting rid of buyers or sellers?
💰“The Power of Price Action”
Quotes:
“Let Price Tell the Story.”
“Price Never Lies – Everything Else Might.”
“Trade What You See, Not What You Think.”
“Candles Speak Louder Than Indicators.”
- “The Truth is in the Candles.”
Crypto Chart
Forex Chart
Stock Chart
Metal Chart
Lorem ipsum dolor sit amet, consectetur adipiscing elit. Ut elit tellus, luctus nec ullamcorper mattis, pulvinar dapibus leo.
Lorem ipsum dolor sit amet, consectetur adipiscing elit. Ut elit tellus, luctus nec ullamcorper mattis, pulvinar dapibus leo.
Lorem ipsum dolor sit amet, consectetur adipiscing elit. Ut elit tellus, luctus nec ullamcorper mattis, pulvinar dapibus leo.
Lorem ipsum dolor sit amet, consectetur adipiscing elit. Ut elit tellus, luctus nec ullamcorper mattis, pulvinar dapibus leo.
Take Profit Charts
- Is the current trend bullish or bearish?
2. Is the main trend bullish or bearish on selected timeframe?
3. Where is price now? where are the keylevels?
4. Are there any Price Action?
5. Are there any failed Price Action?
6. Is there evidence that the market is getting rid of buyers or sellers?
💰“The Power of Price Action”
Quotes:
“Let Price Tell the Story.”
“Price Never Lies – Everything Else Might.”
“Trade What You See, Not What You Think.”
“Candles Speak Louder Than Indicators.”
- “The Truth is in the Candles.”
Price action trading charts involve the analysis of raw price movement displayed directly on a chart, typically using candlesticks or bars. This method prioritizes the visual interpretation of how buyers and sellers are interacting, without the immediate reliance on secondary indicators.
By observing patterns in price highs, lows, opens, and closes, traders aim to understand market psychology, identify key support and resistance levels, and discern potential trends or reversals. It’s a direct approach to market analysis, where the price itself is considered the most comprehensive and reliable source of information for making trading decisions.
Trading Charts: Your Market Decoder Ring (and Reality Show!)
Ever stare at a bunch of flickering numbers and think, “There has to be a better way to understand this chaos?” Well, my friend, say hello to Trading Charts!
These aren’t just fancy graphs; they’re the market’s own reality show, condensed into a visual story. Each bar or candlestick is a tiny drama playing out, showing you exactly where the price opened, closed, and briefly went crazy, all over a specific period.
Think of it as your personal decoder ring for the financial world. Instead of trying to guess what’s happening, you’re literally seeing the market’s past behavior laid out before you. Are prices skyrocketing like a cat on a trampoline? Or are they plummeting like a lead balloon? Your chart tells all!
So, grab your popcorn. By learning to read these visual diaries, you’ll start spotting patterns, understanding the market’s moods, and maybe even predicting its next dramatic plot twist. It’s less guesswork, more “aha!” moments.

Charts
Price Action Charts
Lorem ipsum dolor sit amet, consectetur adipiscing elit. Ut elit tellus, luctus nec ullamcorper mattis, pulvinar dapibus leo.
Lorem ipsum dolor sit amet, consectetur adipiscing elit. Ut elit tellus, luctus nec ullamcorper mattis, pulvinar dapibus leo.
Lorem ipsum dolor sit amet, consectetur adipiscing elit. Ut elit tellus, luctus nec ullamcorper mattis, pulvinar dapibus leo.
“Price action strips away the noise—what you see is what the market is doing.”
“Charts tell the truth: no indicators, no lag, just raw market behavior.”
“Price action reveals the story behind every candle.”
“Simplicity wins—price action keeps trading clean and clear.”
“With price action, you learn to read the market, not chase signals.”
Lorem ipsum dolor sit amet, consectetur adipiscing elit. Ut elit tellus, luctus nec ullamcorper mattis, pulvinar dapibus leo.
Lorem ipsum dolor sit amet, consectetur adipiscing elit. Ut elit tellus, luctus nec ullamcorper mattis, pulvinar dapibus leo.
Price Action Charts
- Is the current trend bullish or bearish?
2. Is the main trend bullish or bearish on selected timeframe?
3. Where is price now? where are the keylevels?
4. Are there any Price Action?
5. Are there any failed Price Action?
6. Is there evidence that the market is getting rid of buyers or sellers?
💰“The Power of Price Action”
Quotes:
“Let Price Tell the Story.”
“Price Never Lies – Everything Else Might.”
“Trade What You See, Not What You Think.”
“Candles Speak Louder Than Indicators.”
- “The Truth is in the Candles.”
Price action trading charts involve the analysis of raw price movement displayed directly on a chart, typically using candlesticks or bars. This method prioritizes the visual interpretation of how buyers and sellers are interacting, without the immediate reliance on secondary indicators.
By observing patterns in price highs, lows, opens, and closes, traders aim to understand market psychology, identify key support and resistance levels, and discern potential trends or reversals. It’s a direct approach to market analysis, where the price itself is considered the most comprehensive and reliable source of information for making trading decisions.
Forex
Ever stare at a bunch of flickering numbers and think, “There has to be a better way to understand this chaos?” Well, my friend, say hello to Trading Charts!
These aren’t just fancy graphs; they’re the market’s own reality show, condensed into a visual story. Each bar or candlestick is a tiny drama playing out, showing you exactly where the price opened, closed, and briefly went crazy, all over a specific period.
Think of it as your personal decoder ring for the financial world. Instead of trying to guess what’s happening, you’re literally seeing the market’s past behavior laid out before you. Are prices skyrocketing like a cat on a trampoline? Or are they plummeting like a lead balloon? Your chart tells all!
So, grab your popcorn. By learning to read these visual diaries, you’ll start spotting patterns, understanding the market’s moods, and maybe even predicting its next dramatic plot twist. It’s less guesswork, more “aha!” moments.
Metal
Ever stare at a bunch of flickering numbers and think, “There has to be a better way to understand this chaos?” Well, my friend, say hello to Trading Charts!
These aren’t just fancy graphs; they’re the market’s own reality show, condensed into a visual story. Each bar or candlestick is a tiny drama playing out, showing you exactly where the price opened, closed, and briefly went crazy, all over a specific period.
Think of it as your personal decoder ring for the financial world. Instead of trying to guess what’s happening, you’re literally seeing the market’s past behavior laid out before you. Are prices skyrocketing like a cat on a trampoline? Or are they plummeting like a lead balloon? Your chart tells all!
So, grab your popcorn. By learning to read these visual diaries, you’ll start spotting patterns, understanding the market’s moods, and maybe even predicting its next dramatic plot twist. It’s less guesswork, more “aha!” moments.
Crypto
Ever stare at a bunch of flickering numbers and think, “There has to be a better way to understand this chaos?” Well, my friend, say hello to Trading Charts!
These aren’t just fancy graphs; they’re the market’s own reality show, condensed into a visual story. Each bar or candlestick is a tiny drama playing out, showing you exactly where the price opened, closed, and briefly went crazy, all over a specific period.
Think of it as your personal decoder ring for the financial world. Instead of trying to guess what’s happening, you’re literally seeing the market’s past behavior laid out before you. Are prices skyrocketing like a cat on a trampoline? Or are they plummeting like a lead balloon? Your chart tells all!
So, grab your popcorn. By learning to read these visual diaries, you’ll start spotting patterns, understanding the market’s moods, and maybe even predicting its next dramatic plot twist. It’s less guesswork, more “aha!” moments.
Stocks
Ever stare at a bunch of flickering numbers and think, “There has to be a better way to understand this chaos?” Well, my friend, say hello to Trading Charts!
These aren’t just fancy graphs; they’re the market’s own reality show, condensed into a visual story. Each bar or candlestick is a tiny drama playing out, showing you exactly where the price opened, closed, and briefly went crazy, all over a specific period.
Think of it as your personal decoder ring for the financial world. Instead of trying to guess what’s happening, you’re literally seeing the market’s past behavior laid out before you. Are prices skyrocketing like a cat on a trampoline? Or are they plummeting like a lead balloon? Your chart tells all!
So, grab your popcorn. By learning to read these visual diaries, you’ll start spotting patterns, understanding the market’s moods, and maybe even predicting its next dramatic plot twist. It’s less guesswork, more “aha!” moments.
Crypto Chart
Forex Chart
Lorem ipsum dolor sit amet, consectetur adipiscing elit. Ut elit tellus, luctus nec ullamcorper mattis, pulvinar dapibus leo.
Lorem ipsum dolor sit amet, consectetur adipiscing elit. Ut elit tellus, luctus nec ullamcorper mattis, pulvinar dapibus leo.
Lorem ipsum dolor sit amet, consectetur adipiscing elit. Ut elit tellus, luctus nec ullamcorper mattis, pulvinar dapibus leo.
Lorem ipsum dolor sit amet, consectetur adipiscing elit. Ut elit tellus, luctus nec ullamcorper mattis, pulvinar dapibus leo.
Stock Chart
Metal Chart
Lorem ipsum dolor sit amet, consectetur adipiscing elit. Ut elit tellus, luctus nec ullamcorper mattis, pulvinar dapibus leo.
Lorem ipsum dolor sit amet, consectetur adipiscing elit. Ut elit tellus, luctus nec ullamcorper mattis, pulvinar dapibus leo.
Lorem ipsum dolor sit amet, consectetur adipiscing elit. Ut elit tellus, luctus nec ullamcorper mattis, pulvinar dapibus leo.
Lorem ipsum dolor sit amet, consectetur adipiscing elit. Ut elit tellus, luctus nec ullamcorper mattis, pulvinar dapibus leo.
Charts
Price Action Charts
“Price action strips away the noise—what you see is what the market is doing.”
“Charts tell the truth: no indicators, no lag, just raw market behavior.”
“Price action reveals the story behind every candle.”
“Simplicity wins—price action keeps trading clean and clear.”
“With price action, you learn to read the market, not chase signals.”
- Is the current trend bullish or bearish?
2. Is the main trend bullish or bearish on selected timeframe?
3. Where is price now? where are the keylevels?
4. Are there any Price Action?
5. Are there any failed Price Action?
6. Is there evidence that the market is getting rid of buyers or sellers?
💰“The Power of Price Action”
Quotes:
“Let Price Tell the Story.”
“Price Never Lies – Everything Else Might.”
“Trade What You See, Not What You Think.”
“Candles Speak Louder Than Indicators.”
- “The Truth is in the Candles.”
Price action trading charts involve the analysis of raw price movement displayed directly on a chart, typically using candlesticks or bars. This method prioritizes the visual interpretation of how buyers and sellers are interacting, without the immediate reliance on secondary indicators.
By observing patterns in price highs, lows, opens, and closes, traders aim to understand market psychology, identify key support and resistance levels, and discern potential trends or reversals. It’s a direct approach to market analysis, where the price itself is considered the most comprehensive and reliable source of information for making trading decisions.
Crypto Chart
Forex Chart
Lorem ipsum dolor sit amet, consectetur adipiscing elit. Ut elit tellus, luctus nec ullamcorper mattis, pulvinar dapibus leo.
Lorem ipsum dolor sit amet, consectetur adipiscing elit. Ut elit tellus, luctus nec ullamcorper mattis, pulvinar dapibus leo.
Lorem ipsum dolor sit amet, consectetur adipiscing elit. Ut elit tellus, luctus nec ullamcorper mattis, pulvinar dapibus leo.
Lorem ipsum dolor sit amet, consectetur adipiscing elit. Ut elit tellus, luctus nec ullamcorper mattis, pulvinar dapibus leo.
Stock Chart
Metal Chart
Lorem ipsum dolor sit amet, consectetur adipiscing elit. Ut elit tellus, luctus nec ullamcorper mattis, pulvinar dapibus leo.
Lorem ipsum dolor sit amet, consectetur adipiscing elit. Ut elit tellus, luctus nec ullamcorper mattis, pulvinar dapibus leo.
Lorem ipsum dolor sit amet, consectetur adipiscing elit. Ut elit tellus, luctus nec ullamcorper mattis, pulvinar dapibus leo.
Lorem ipsum dolor sit amet, consectetur adipiscing elit. Ut elit tellus, luctus nec ullamcorper mattis, pulvinar dapibus leo.
Price Action Charts
“Price action strips away the noise—what you see is what the market is doing.”
-
“Charts tell the truth: no indicators, no lag, just raw market behavior.”
-
“Price action reveals the story behind every candle.”
-
“Simplicity wins—price action keeps trading clean and clear.”
-
“With price action, you learn to read the market, not chase signals.”
Lorem ipsum dolor sit amet, consectetur adipiscing elit. Ut elit tellus, luctus nec ullamcorper mattis, pulvinar dapibus leo.
- Is the current trend bullish or bearish?
2. Is the main trend bullish or bearish on selected timeframe?
3. Where is price now? where are the keylevels?
4. Are there any Price Action?
5. Are there any failed Price Action?
6. Is there evidence that the market is getting rid of buyers or sellers?
💰“The Power of Price Action”
Quotes:
“Let Price Tell the Story.”
“Price Never Lies – Everything Else Might.”
“Trade What You See, Not What You Think.”
“Candles Speak Louder Than Indicators.”
- “The Truth is in the Candles.”
Price action trading charts involve the analysis of raw price movement displayed directly on a chart, typically using candlesticks or bars. This method prioritizes the visual interpretation of how buyers and sellers are interacting, without the immediate reliance on secondary indicators.
By observing patterns in price highs, lows, opens, and closes, traders aim to understand market psychology, identify key support and resistance levels, and discern potential trends or reversals. It’s a direct approach to market analysis, where the price itself is considered the most comprehensive and reliable source of information for making trading decisions.
Crypto Chart
Forex Chart
Lorem ipsum dolor sit amet, consectetur adipiscing elit. Ut elit tellus, luctus nec ullamcorper mattis, pulvinar dapibus leo.
Lorem ipsum dolor sit amet, consectetur adipiscing elit. Ut elit tellus, luctus nec ullamcorper mattis, pulvinar dapibus leo.
Lorem ipsum dolor sit amet, consectetur adipiscing elit. Ut elit tellus, luctus nec ullamcorper mattis, pulvinar dapibus leo.
Lorem ipsum dolor sit amet, consectetur adipiscing elit. Ut elit tellus, luctus nec ullamcorper mattis, pulvinar dapibus leo.
Stock Chart
Metal Chart
Lorem ipsum dolor sit amet, consectetur adipiscing elit. Ut elit tellus, luctus nec ullamcorper mattis, pulvinar dapibus leo.
Lorem ipsum dolor sit amet, consectetur adipiscing elit. Ut elit tellus, luctus nec ullamcorper mattis, pulvinar dapibus leo.
Lorem ipsum dolor sit amet, consectetur adipiscing elit. Ut elit tellus, luctus nec ullamcorper mattis, pulvinar dapibus leo.
Lorem ipsum dolor sit amet, consectetur adipiscing elit. Ut elit tellus, luctus nec ullamcorper mattis, pulvinar dapibus leo.
Price Action Charts
“Price action strips away the noise—what you see is what the market is doing.”
-
“Charts tell the truth: no indicators, no lag, just raw market behavior.”
-
“Price action reveals the story behind every candle.”
-
“Simplicity wins—price action keeps trading clean and clear.”
-
“With price action, you learn to read the market, not chase signals.”
- Is the current trend bullish or bearish?
2. Is the main trend bullish or bearish on selected timeframe?
3. Where is price now? where are the keylevels?
4. Are there any Price Action?
5. Are there any failed Price Action?
6. Is there evidence that the market is getting rid of buyers or sellers?
💰“The Power of Price Action”
Quotes:
“Let Price Tell the Story.”
“Price Never Lies – Everything Else Might.”
“Trade What You See, Not What You Think.”
“Candles Speak Louder Than Indicators.”
- “The Truth is in the Candles.”
Price action trading charts involve the analysis of raw price movement displayed directly on a chart, typically using candlesticks or bars. This method prioritizes the visual interpretation of how buyers and sellers are interacting, without the immediate reliance on secondary indicators.
By observing patterns in price highs, lows, opens, and closes, traders aim to understand market psychology, identify key support and resistance levels, and discern potential trends or reversals. It’s a direct approach to market analysis, where the price itself is considered the most comprehensive and reliable source of information for making trading decisions.
Trading Charts: Your Market Decoder Ring (and Reality Show!)
Ever stare at a bunch of flickering numbers and think, “There has to be a better way to understand this chaos?” Well, my friend, say hello to Trading Charts!
These aren’t just fancy graphs; they’re the market’s own reality show, condensed into a visual story. Each bar or candlestick is a tiny drama playing out, showing you exactly where the price opened, closed, and briefly went crazy, all over a specific period.
Think of it as your personal decoder ring for the financial world. Instead of trying to guess what’s happening, you’re literally seeing the market’s past behavior laid out before you. Are prices skyrocketing like a cat on a trampoline? Or are they plummeting like a lead balloon? Your chart tells all!
So, grab your popcorn. By learning to read these visual diaries, you’ll start spotting patterns, understanding the market’s moods, and maybe even predicting its next dramatic plot twist. It’s less guesswork, more “aha!” moments.
Price action trading charts emphasize the study of a financial instrument’s price movements over time as the primary source of trading signals. This analytical method focuses on the patterns, structure, and behavior of candlesticks or bars, along with their relationship to key price levels.
The core idea is to understand what the market is communicating directly through its price, without the potential lag or complexity introduced by technical indicators. Traders interpret the battle between buyers and sellers, identify momentum, and anticipate potential shifts by closely observing how price unfolds and reacts within different timeframes, offering a streamlined approach to market analysis.
Trading Charts: Your Crystal Ball (That Only Shows the Past)
Ever wish you had a crystal ball to predict where the market’s going next? Well, you’re in luck! Meet Trading Charts – they’re exactly like a crystal ball, except they only show you what already happened!
But don’t scoff! By carefully examining these squiggly lines and colorful bars, you’re actually reading the market’s historical footprint. Each little flicker, each rise and fall, is a clue. You’re basically a financial detective, piecing together the market’s past crimes (and triumphs) to figure out its likely next move.
So, while they won’t tell you tomorrow’s lottery numbers, charts give you the visual evidence you need to understand the market’s moods, patterns, and probable next steps. They turn the chaotic noise of prices into a readable story. Get ready to put on your detective hat and see what secrets the market’s been keeping!
Crypto Chart
Forex Chart
Lorem ipsum dolor sit amet, consectetur adipiscing elit. Ut elit tellus, luctus nec ullamcorper mattis, pulvinar dapibus leo.
Lorem ipsum dolor sit amet, consectetur adipiscing elit. Ut elit tellus, luctus nec ullamcorper mattis, pulvinar dapibus leo.
Lorem ipsum dolor sit amet, consectetur adipiscing elit. Ut elit tellus, luctus nec ullamcorper mattis, pulvinar dapibus leo.
Lorem ipsum dolor sit amet, consectetur adipiscing elit. Ut elit tellus, luctus nec ullamcorper mattis, pulvinar dapibus leo.
Stock Chart
Metal Chart
Lorem ipsum dolor sit amet, consectetur adipiscing elit. Ut elit tellus, luctus nec ullamcorper mattis, pulvinar dapibus leo.
Lorem ipsum dolor sit amet, consectetur adipiscing elit. Ut elit tellus, luctus nec ullamcorper mattis, pulvinar dapibus leo.
Lorem ipsum dolor sit amet, consectetur adipiscing elit. Ut elit tellus, luctus nec ullamcorper mattis, pulvinar dapibus leo.
Lorem ipsum dolor sit amet, consectetur adipiscing elit. Ut elit tellus, luctus nec ullamcorper mattis, pulvinar dapibus leo.
Chart of the Day
Swing Trading
💰
“Enter the trade — then sit on your hands like a monk!”
“We don’t click and panic. We click and chill.”
“Traders who wait, get paid. Traders who fidget… donate!”
“We enter the trade, then do absolutely nothing like pros.”
“Let the market work. You’re not its boss.”
Lorem ipsum dolor sit amet, consectetur adipiscing elit. Ut elit tellus, luctus nec ullamcorper mattis, pulvinar dapibus leo.
💰
Price action is the foundation of technical trading. It refers to the movement of price over time, without relying on indicators. Here’s why it’s powerful:
🔥 The Power of Price Action:
Simplicity
Price action strips away distractions. Traders read candles, structure, and key levels directly from the chart.Real-Time Clarity
It reflects real-time decisions of buyers and sellers, showing where the market is reacting.Universal Application
Works on all timeframes and markets—forex, stocks, crypto.Identifies Key Setups
Patterns like:Pin bars
Engulfing candles
Inside bars
Break and retest
provide high-probability entries.
Institutional Footprints
Price action helps you “see” what smart money is doing—entries at key levels, liquidity grabs, false breaks, etc.No Lag
Unlike indicators, it’s immediate—based on what’s happening now, not 10 bars ago.
💰
“Enter the trade — then sit on your hands like a monk!”
“We don’t click and panic. We click and chill.”
“Traders who wait, get paid. Traders who fidget… donate!”
“We enter the trade, then do absolutely nothing like pros.”
“Let the market work. You’re not its boss.”
💰
“Enter the trade — then sit on your hands like a monk!”
“We don’t click and panic. We click and chill.”
“Traders who wait, get paid. Traders who fidget… donate!”
“We enter the trade, then do absolutely nothing like pros.”
“Let the market work. You’re not its boss.”
Price Action Charts
- Is the current trend bullish or bearish?
2. Is the main trend bullish or bearish on selected timeframe?
3. Where is price now? where are the keylevels?
4. Are there any Price Action?
5. Are there any failed Price Action?
6. Is there evidence that the market is getting rid of buyers or sellers?
💰“The Power of Price Action”
Quotes:
“Let Price Tell the Story.”
“Price Never Lies – Everything Else Might.”
“Trade What You See, Not What You Think.”
“Candles Speak Louder Than Indicators.”
- “The Truth is in the Candles.”
Price action trading charts involve the analysis of raw price movement displayed directly on a chart, typically using candlesticks or bars. This method prioritizes the visual interpretation of how buyers and sellers are interacting, without the immediate reliance on secondary indicators.
By observing patterns in price highs, lows, opens, and closes, traders aim to understand market psychology, identify key support and resistance levels, and discern potential trends or reversals. It’s a direct approach to market analysis, where the price itself is considered the most comprehensive and reliable source of information for making trading decisions.
Trading Charts: Your Market Decoder Ring (and Reality Show!)
Ever stare at a bunch of flickering numbers and think, “There has to be a better way to understand this chaos?” Well, my friend, say hello to Trading Charts!
These aren’t just fancy graphs; they’re the market’s own reality show, condensed into a visual story. Each bar or candlestick is a tiny drama playing out, showing you exactly where the price opened, closed, and briefly went crazy, all over a specific period.
Think of it as your personal decoder ring for the financial world. Instead of trying to guess what’s happening, you’re literally seeing the market’s past behavior laid out before you. Are prices skyrocketing like a cat on a trampoline? Or are they plummeting like a lead balloon? Your chart tells all!
So, grab your popcorn. By learning to read these visual diaries, you’ll start spotting patterns, understanding the market’s moods, and maybe even predicting its next dramatic plot twist. It’s less guesswork, more “aha!” moments.
Price Action Charts
- Is the current trend bullish or bearish?
2. Is the main trend bullish or bearish on selected timeframe?
3. Where is price now? where are the keylevels?
4. Are there any Price Action?
5. Are there any failed Price Action?
6. Is there evidence that the market is getting rid of buyers or sellers?
💰“The Power of Price Action”
Quotes:
“Let Price Tell the Story.”
“Price Never Lies – Everything Else Might.”
“Trade What You See, Not What You Think.”
“Candles Speak Louder Than Indicators.”
- “The Truth is in the Candles.”
Crypto Chart
Forex Chart
Stock Chart
Metal Chart
Lorem ipsum dolor sit amet, consectetur adipiscing elit. Ut elit tellus, luctus nec ullamcorper mattis, pulvinar dapibus leo.
Lorem ipsum dolor sit amet, consectetur adipiscing elit. Ut elit tellus, luctus nec ullamcorper mattis, pulvinar dapibus leo.
Lorem ipsum dolor sit amet, consectetur adipiscing elit. Ut elit tellus, luctus nec ullamcorper mattis, pulvinar dapibus leo.
Lorem ipsum dolor sit amet, consectetur adipiscing elit. Ut elit tellus, luctus nec ullamcorper mattis, pulvinar dapibus leo.
Forex
💰
“Enter the trade — then sit on your hands like a monk!”
“We don’t click and panic. We click and chill.”
“Traders who wait, get paid. Traders who fidget… donate!”
“We enter the trade, then do absolutely nothing like pros.”
“Let the market work. You’re not its boss.”
Lorem ipsum dolor sit amet, consectetur adipiscing elit. Ut elit tellus, luctus nec ullamcorper mattis, pulvinar dapibus leo.
💰
Price action is the foundation of technical trading. It refers to the movement of price over time, without relying on indicators. Here’s why it’s powerful:
🔥 The Power of Price Action:
Simplicity
Price action strips away distractions. Traders read candles, structure, and key levels directly from the chart.Real-Time Clarity
It reflects real-time decisions of buyers and sellers, showing where the market is reacting.Universal Application
Works on all timeframes and markets—forex, stocks, crypto.Identifies Key Setups
Patterns like:Pin bars
Engulfing candles
Inside bars
Break and retest
provide high-probability entries.
Institutional Footprints
Price action helps you “see” what smart money is doing—entries at key levels, liquidity grabs, false breaks, etc.No Lag
Unlike indicators, it’s immediate—based on what’s happening now, not 10 bars ago.
Stocks
💰
“Enter the trade — then sit on your hands like a monk!”
“We don’t click and panic. We click and chill.”
“Traders who wait, get paid. Traders who fidget… donate!”
“We enter the trade, then do absolutely nothing like pros.”
“Let the market work. You’re not its boss.”
Lorem ipsum dolor sit amet, consectetur adipiscing elit. Ut elit tellus, luctus nec ullamcorper mattis, pulvinar dapibus leo.
💰
Price action is the foundation of technical trading. It refers to the movement of price over time, without relying on indicators. Here’s why it’s powerful:
🔥 The Power of Price Action:
Simplicity
Price action strips away distractions. Traders read candles, structure, and key levels directly from the chart.Real-Time Clarity
It reflects real-time decisions of buyers and sellers, showing where the market is reacting.Universal Application
Works on all timeframes and markets—forex, stocks, crypto.Identifies Key Setups
Patterns like:Pin bars
Engulfing candles
Inside bars
Break and retest
provide high-probability entries.
Institutional Footprints
Price action helps you “see” what smart money is doing—entries at key levels, liquidity grabs, false breaks, etc.No Lag
Unlike indicators, it’s immediate—based on what’s happening now, not 10 bars ago.
Price Action

- Is the current trend bullish or bearish?
2. Is the main trend bullish or bearish on selected timeframe?
3. Where is price now? where are the keylevels?
4. Are there any Price Action?
5. Are there any failed Price Action?
6. Is there evidence that the market is getting rid of buyers or sellers?
💰“The Power of Price Action”
Quotes:
“Let Price Tell the Story.”
“Price Never Lies – Everything Else Might.”
“Trade What You See, Not What You Think.”
“Candles Speak Louder Than Indicators.”
- “The Truth is in the Candles.”
7. The Story of the Pullback
Alright, gather ’round, aspiring market adventurers, and let’s talk about the holy grail of trading sanity, the secret sauce to not blowing up your account like an ill-fated fireworks display on the Fourth of July in Barcelona: the Risk/Reward Ratio!
Imagine you’re at a ridiculously fancy buffet (it’s Friday, July 4th, 2025, after all, and we’re feeling celebratory in sunny Barcelona!). You see two trays:
Tray A: Contains a single, slightly bruised olive. If you eat it, you get one point. But, oh no! If you don’t like it, you lose one point.
Tray B: Holds a glistening, perfectly cooked lobster tail. If you eat it, you get three glorious points! But, if it turns out to be secretly made of rubber (hey, it’s a fancy buffet, but still!), you lose one point.
Which one do you go for? If you’ve got half a brain and an appetite for success, you’re eyeing that lobster tail! Why? Because the potential deliciousness (reward) far outweighs the risk of a rubbery bite (risk)!
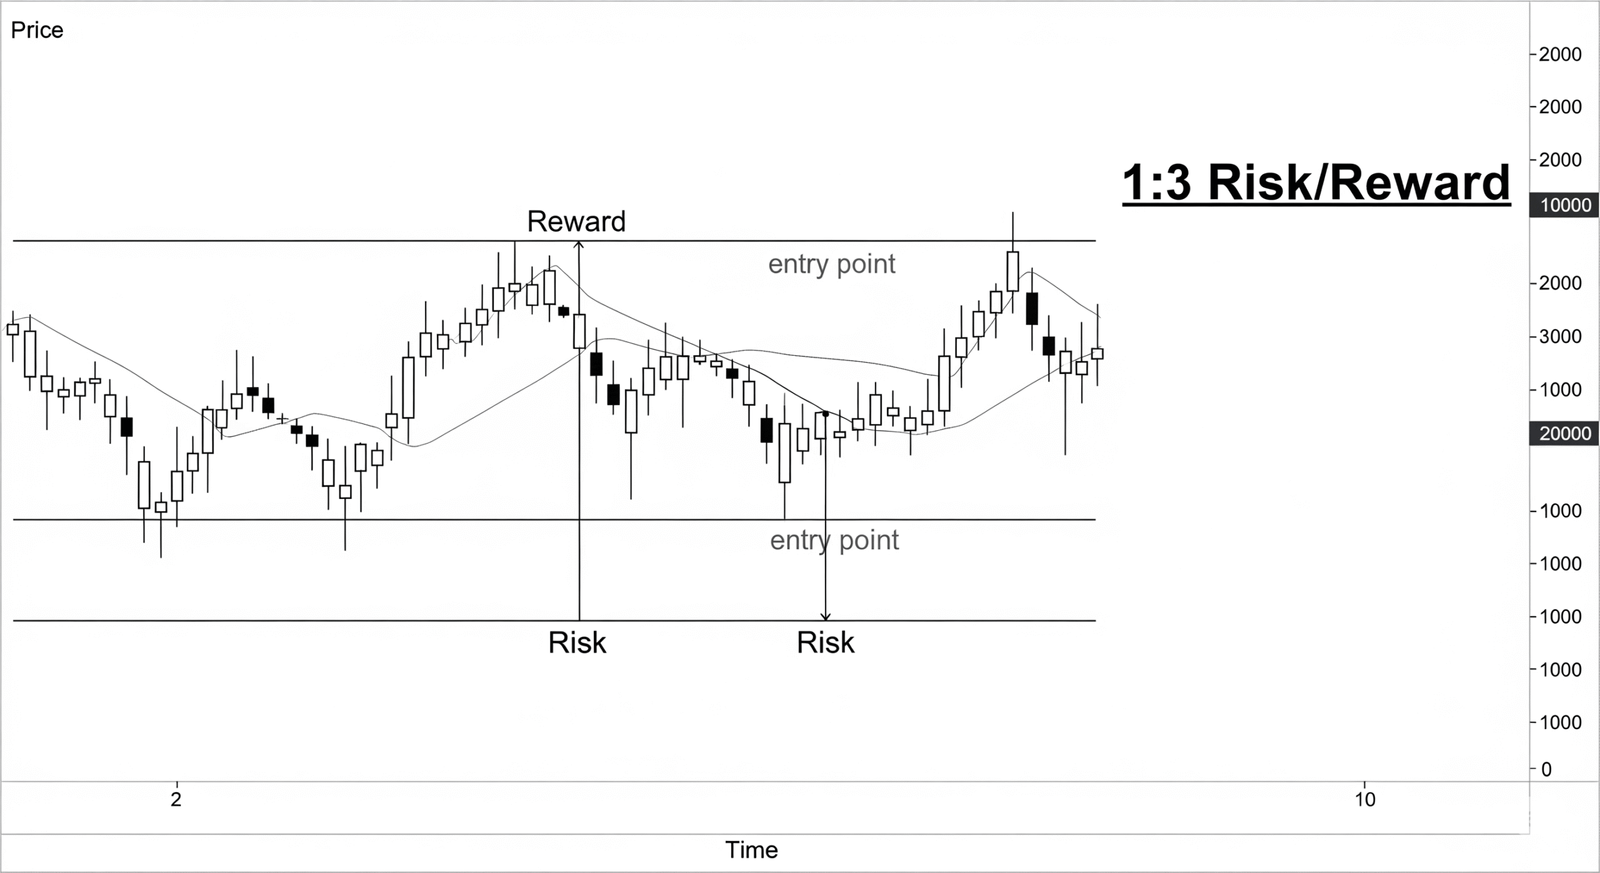
The Risk/Reward Ratio: Your Trading Buffet Guide!
In trading, the Risk/Reward Ratio (often shortened to R:R) is simply a way to measure how much you stand to gain on a trade versus how much you stand to lose if it goes wrong.
It’s expressed like this: 1:X (e.g., 1:2, 1:3, 1:5)
The “1” always represents your Risk (how much money you’re willing to lose, defined by your stop-loss).
The “X” represents your Reward (how much money you expect to gain, defined by your take-profit target).
Think of it as your Trade-Off Meter:
1:1 Ratio (The “Meh” Meal): You risk $100 to potentially make $100. It’s like flipping a coin for dinner. Not very exciting, is it? You’ve got to be right 51% of the time just to break even after commissions. BORING!
1:2 Ratio (The “Smart Snacker”): You risk $100 to potentially make $200. Now we’re talking! This means for every dollar you put on the line, you’re aiming to pull back two. Even if you’re only right 40% of the time, you can still be profitable! This is like ordering a tapas platter where even if one dish is a bit bland, the others make up for it.
1:3 Ratio (The “Feast Finder”): You risk $100 to potentially make $300. Woohoo! Now you’re getting serious! For every buck you put on the line, you’re hoping for three back. You could be wrong 60% of the time and still make money! This is like finding a Michelin-star restaurant that gives you free desserts if you don’t like the main course. Legendary!
1:5, 1:10, and Beyond (The “Whale Hunter”): These are the legendary ratios, where you’re aiming for massive payouts compared to your tiny risk. It’s like finding a whole school of tuna in the Mediterranean when you only cast a tiny net. These trades might not come often, but when they do, they can make your year!
Why is it So Crucial for Your Wallet (and Your Sanity)?
Because, my friend, you don’t have to be right all the time to be profitable! This is the ultimate mind-blower for new traders.
If you always aim for a 1:2 R:R, and you win only 40% of your trades, guess what? You’re still making money! (4 winning trades x $200 = $800; 6 losing trades x $100 = $600 loss. Net profit = $200!)
If you’re stuck aiming for 1:1, you’d need to win 55-60% just to stay afloat due to trading costs. That’s a lot more pressure!
So, next time you’re eyeing a potential trade, don’t just look at the entry point. First, identify your stop-loss (your escape hatch if things go south – the risk). Then, pinpoint your take-profit (your destination for gains – the reward). Calculate that glorious ratio.
If it’s not at least 1:2 or 1:3 (depending on your strategy’s win rate), then politely decline, turn on some chill beach music, and enjoy the Barcelona sunshine. Because the best trades are like the best parties: low risk, high reward, and totally worth the wait!
💰Quotes:
“Enter the trade — then sit on your hands like a monk!”
“We don’t click and panic. We click and chill.”
“Traders who wait, get paid. Traders who fidget… donate!”
“We enter the trade, then do absolutely nothing like pros.”
“Let the market work. You’re not its boss.”
💰Normal Tone Slogans:
“Enter with a plan, then let the trade play out.”
“The work is in the setup — the result comes with patience.”
“We don’t babysit trades. We trust our edge.”
“Entry is action. Waiting is discipline.”
“After entry, emotion has no place — only patience.”
