Add Your Heading Text Here


What is Price Action?!
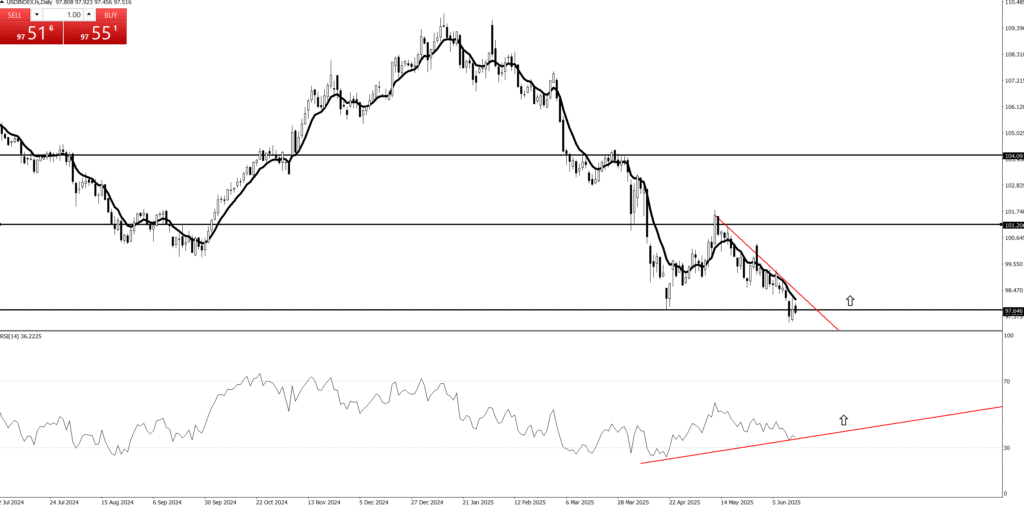
Price action is a trading methodology that analyzes the movement of an asset’s price over time to make trading decisions. It is the foundation of technical analysis and operates on the principle that all relevant market information—including economic news, investor sentiment, and fundamental data—is already reflected in the asset’s price.
Instead of relying on lagging technical indicators, traders who use price action focus on a “naked” or clean chart. By observing historical price data, they identify patterns, trends, and key levels to predict future price direction.The core concepts of price action analysis include:
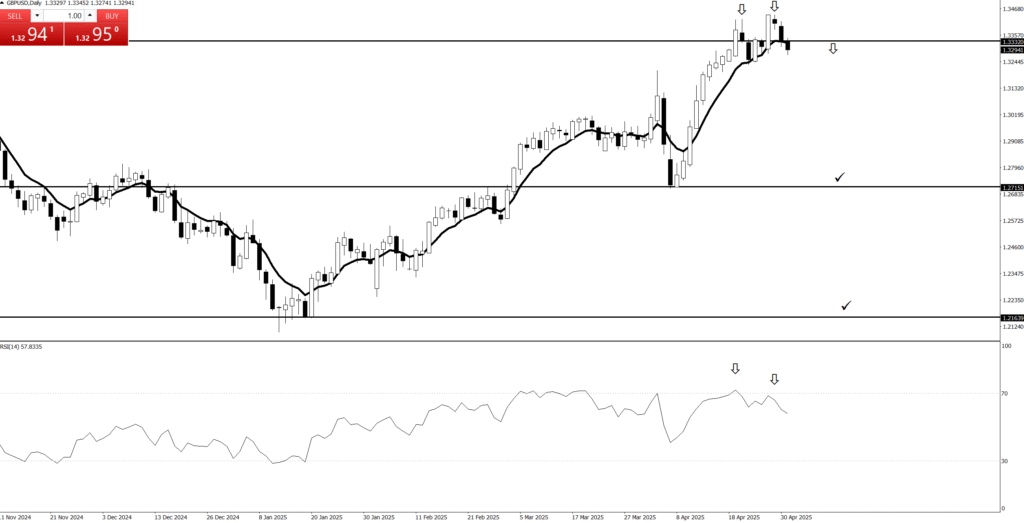
Support and Resistance
These are price levels where an asset’s price has historically paused or reversed direction. A support level is a price floor where buying pressure is strong enough to prevent the price from falling further. A resistance level is a price ceiling where selling pressure is sufficient to stop the price from rising higher.
Lorem ipsum dolor sit amet, consectetur adipiscing elit. Ut elit tellus, luctus nec ullamcorper mattis, pulvinar dapibus leo.
The Power of PriceAction
What is Price Action?!
Price action is a trading methodology that analyzes the movement of an asset’s price over time to make trading decisions. It is the foundation of technical analysis and operates on the principle that all relevant market information—including economic news, investor sentiment, and fundamental data—is already reflected in the asset’s price.
Instead of relying on lagging technical indicators, traders who use price action focus on a “naked” or clean chart. By observing historical price data, they identify patterns, trends, and key levels to predict future price direction.The core concepts of price action analysis include:Support and Resistance
These are price levels where an asset’s price has historically paused or reversed direction. A support level is a price floor where buying pressure is strong enough to prevent the price from falling further. A resistance level is a price ceiling where selling pressure is sufficient to stop the price from rising higher.
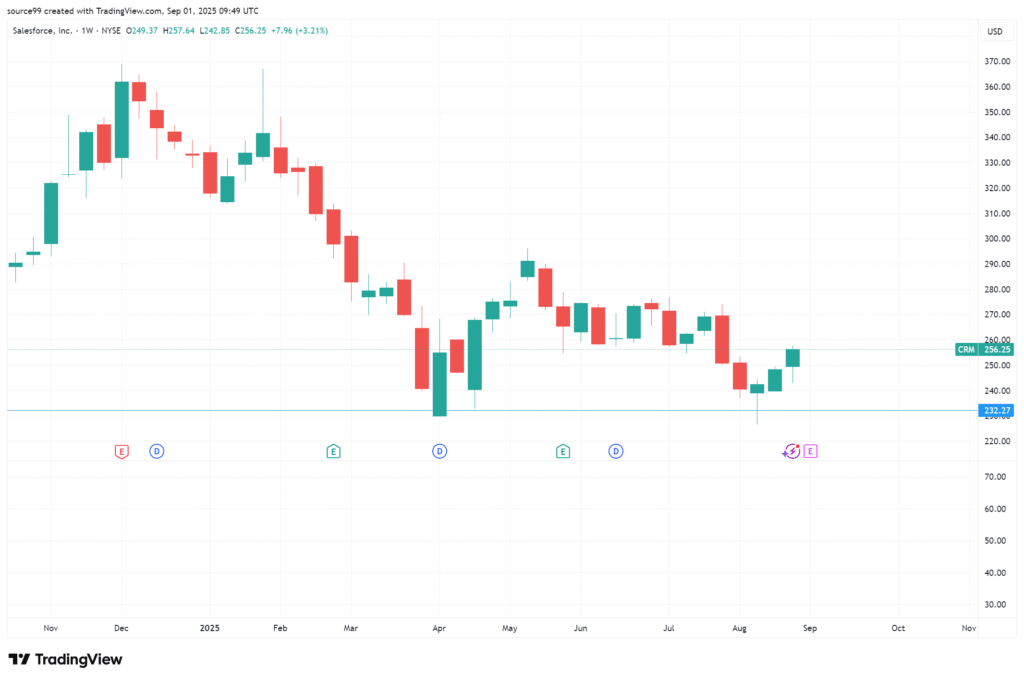
Candlestick Patterns
Candlestick charts are a primary tool for price action traders. Each candlestick represents a specific period and shows the open, high, low, and closing prices. The shape and color of the candlesticks form patterns (e.g., Doji, Hammer, Engulfing) that provide insights into market sentiment and can signal potential reversals or continuations.
Trend Analysis
Price action traders identify the market’s trend by observing the sequence of highs and lows. An uptrend is characterized by a series of higher highs and higher lows, while a downtrend is marked by lower highs and lower lows. A break in this sequence can indicate a potential trend reversal.
💰Quotes:
“Price action is the only truth on the chart.”
“Everything you need to know is written in the candles.”
“Indicators lag, price action leads.”
“Trade what you see, not what you think.”
“Every candle tells a story. Learn to read it.”

💰Quotes:
“Support and resistance are the footprints of money.”
“A closed candle is a fact, an open candle is only a possibility.”
“The market doesn’t hide; it leaves clues in price action.”
“The best trades look obvious… after you’ve learned to see them.”
“Patterns are just human emotions drawn on a chart.”
The Power of PriceAction

What is Price Action?!
Price action is a trading methodology that analyzes the movement of an asset’s price over time to make trading decisions. It is the foundation of technical analysis and operates on the principle that all relevant market information—including economic news, investor sentiment, and fundamental data—is already reflected in the asset’s price.
Instead of relying on lagging technical indicators, traders who use price action focus on a “naked” or clean chart. By observing historical price data, they identify patterns, trends, and key levels to predict future price direction.The core concepts of price action analysis include:Support and Resistance
These are price levels where an asset’s price has historically paused or reversed direction. A support level is a price floor where buying pressure is strong enough to prevent the price from falling further. A resistance level is a price ceiling where selling pressure is sufficient to stop the price from rising higher.
Candlestick Patterns
Candlestick charts are a primary tool for price action traders. Each candlestick represents a specific period and shows the open, high, low, and closing prices. The shape and color of the candlesticks form patterns (e.g., Doji, Hammer, Engulfing) that provide insights into market sentiment and can signal potential reversals or continuations.
Trend Analysis
Price action traders identify the market’s trend by observing the sequence of highs and lows. An uptrend is characterized by a series of higher highs and higher lows, while a downtrend is marked by lower highs and lower lows. A break in this sequence can indicate a potential trend reversal.
💰Quotes:
“Price action is the only truth on the chart.”
“Everything you need to know is written in the candles.”
“Indicators lag, price action leads.”
“Trade what you see, not what you think.”
“Every candle tells a story. Learn to read it.”
💰Quotes:
“Support and resistance are the footprints of money.”
“A closed candle is a fact, an open candle is only a possibility.”
“The market doesn’t hide; it leaves clues in price action.”
“The best trades look obvious… after you’ve learned to see them.”
“Patterns are just human emotions drawn on a chart.”
The Power of PriceAction
💰What in the Kraken’s Name is Price Action?
Imagine you’re on a bustling market street, and everyone’s shouting their prices for pineapples. You don’t need a fancy economist with a spreadsheet to tell you if pineapples are getting more popular or less. You just watch what people are doing: are they eagerly snatching them up at higher prices, or are the vendors struggling to give them away?
Price action is exactly that, but for stocks and other assets! It’s simply reading the story the market is telling you directly through the price itself. No need for complicated, lagging indicators that are always a step behind, like a tired parrot squawking old news. You’re looking at the raw, unfiltered moves on your chart – the ultimate truth of supply and demand, fear and greed.
💰Why is it the Golden Compass of Trading?
Forget trying to navigate with a half-broken sextant! Price action is your North Star, your most reliable guide:
It’s the OG (Original Gangster) Signal: Every indicator you see on a chart is derived from price. Price action is the price. It’s the source code, the main event, the real deal. When you’re looking at price action, you’re getting the news straight from the horse’s mouth, not through a dozen gossipy villagers.
No Lag, Just Action! Imagine trying to surf a wave by looking at where the last wave broke. You’d be wiped out! Many indicators are “lagging,” meaning they tell you what already happened. Price action is live, in the moment, allowing you to catch the wave as it forms. This means quicker decisions, tighter entries, and less time being swept away by unexpected currents.
Simpler Than a Coconut Cocktail: You don’t need a supercomputer or a massive collection of complex tools. A clean chart, your trusty eyeballs, and a basic understanding of candlestick patterns are often all you need. This simplicity reduces overwhelm and helps you make clear, decisive calls without second-guessing.
The Trend is Your Best Mate! Remember that wise old saying, “the trend is your friend”? Price action is the ultimate wingman for spotting that friend! It’s super easy to see if the market is clearly sailing upwards (making higher highs and higher lows), diving downwards (lower lows and lower highs), or just bobbing around in the doldrums. If the trend is clear, you know exactly which direction to point your ship. If it’s messy, price action tells you to stay ashore and enjoy a pineapple smoothie!
💰How to Read the Market’s Secret Diary (The Candlesticks!)
Each little candle on your chart is like a tiny scroll, telling you a mini-story of what happened during that time period (a minute, an hour, a day).
The Body: This is the fat part of the candle. A long green (or white) body means buyers were in control, pushing the price way up. A long red (or black) body means sellers dominated, sending the price tumbling. Think of it as a tug-of-war: who won that round?
The Wicks (or Shadows): These thin lines sticking out from the top and bottom are like antennae, showing you how far the price tried to go but got rejected. A long upper wick means buyers tried to push it high but sellers dragged it back down. A long lower wick means sellers tried to push it low but buyers bravely picked it up. These wicks often whisper secrets about exhaustion or reversals!
By watching how these candles form patterns – like a “Hammer” hitting rock bottom and bouncing back up (a sign of buyers coming to the rescue!), or an “Engulfing” pattern where one big candle swallows the previous one (a dramatic shift in power!) – you start to predict where the currents might take you next.
So, next time you’re charting your course, clear your deck, breathe in that salty air, and let the price action speak to you. It’s the most direct, most powerful, and frankly, the most fun way to understand what’s truly happening in the market and chart your way to potential success!
💰Quotes:
“Price action is the only truth on the chart.”
“Everything you need to know is written in the candles.”
“Indicators lag, price action leads.”
“Trade what you see, not what you think.”
“Every candle tells a story. Learn to read it.”
💰Quotes:
“Support and resistance are the footprints of money.”
“A closed candle is a fact, an open candle is only a possibility.”
“The market doesn’t hide; it leaves clues in price action.”
“The best trades look obvious… after you’ve learned to see them.”
“Patterns are just human emotions drawn on a chart.”
💰Quotes:
“Price action: the art of staring at candles until they confess.”
“Indicators are like rumors; price action is the witness.”
“Trading without price action is like driving blindfolded.”
“Sometimes the best trade is to just let the candle close.”
“If you can’t find the trend, step back and squint—price action is waving at you.”
💰Quotes:
“Enter the trade — then sit on your hands like a monk!”
“We don’t click and panic. We click and chill.”
“Traders who wait, get paid. Traders who fidget… donate!”
“We enter the trade, then do absolutely nothing like pros.”
“Let the market work. You’re not its boss.”
💰Quotes:
“Enter the trade — then sit on your hands like a monk!”
“We don’t click and panic. We click and chill.”
“Traders who wait, get paid. Traders who fidget… donate!”
“We enter the trade, then do absolutely nothing like pros.”
“Let the market work. You’re not its boss.”
💰Quotes:
“Enter the trade — then sit on your hands like a monk!”
“We don’t click and panic. We click and chill.”
“Traders who wait, get paid. Traders who fidget… donate!”
“We enter the trade, then do absolutely nothing like pros.”
“Let the market work. You’re not its boss.”
The Power of PriceAction
What is Price Action?!
Price action is a trading methodology that analyzes the movement of an asset’s price over time to make trading decisions. It is the foundation of technical analysis and operates on the principle that all relevant market information—including economic news, investor sentiment, and fundamental data—is already reflected in the asset’s price.
Instead of relying on lagging technical indicators, traders who use price action focus on a “naked” or clean chart. By observing historical price data, they identify patterns, trends, and key levels to predict future price direction.The core concepts of price action analysis include:Support and Resistance
These are price levels where an asset’s price has historically paused or reversed direction. A support level is a price floor where buying pressure is strong enough to prevent the price from falling further. A resistance level is a price ceiling where selling pressure is sufficient to stop the price from rising higher.
Candlestick Patterns
Candlestick charts are a primary tool for price action traders. Each candlestick represents a specific period and shows the open, high, low, and closing prices. The shape and color of the candlesticks form patterns (e.g., Doji, Hammer, Engulfing) that provide insights into market sentiment and can signal potential reversals or continuations.
Trend Analysis
Price action traders identify the market’s trend by observing the sequence of highs and lows. An uptrend is characterized by a series of higher highs and higher lows, while a downtrend is marked by lower highs and lower lows. A break in this sequence can indicate a potential trend reversal.

💰Quotes:
“Price action is the only truth on the chart.”
“Everything you need to know is written in the candles.”
“Indicators lag, price action leads.”
“Trade what you see, not what you think.”
“Every candle tells a story. Learn to read it.”
💰Quotes:
“Support and resistance are the footprints of money.”
“A closed candle is a fact, an open candle is only a possibility.”
“The market doesn’t hide; it leaves clues in price action.”
“The best trades look obvious… after you’ve learned to see them.”
“Patterns are just human emotions drawn on a chart.”
The Power of PriceAction
What is Price Action?!
- Price action is a trading methodology that analyzes the movement of an asset’s price over time to make trading decisions. It is the foundation of technical analysis and operates on the principle that all relevant market information—including economic news, investor sentiment, and fundamental data—is already reflected in the asset’s price.Instead of relying on lagging technical indicators, traders who use price action focus on a “naked” or clean chart. By observing historical price data, they identify patterns, trends, and key levels to predict future price direction.
Support and Resistance
These are price levels where an asset’s price has historically paused or reversed direction. A support level is a price floor where buying pressure is strong enough to prevent the price from falling further. A resistance level is a price ceiling where selling pressure is sufficient to stop the price from rising higher.
Candlestick Patterns
Candlestick charts are a primary tool for price action traders. Each candlestick represents a specific period and shows the open, high, low, and closing prices. The shape and color of the candlesticks form patterns (e.g., Doji, Hammer, Engulfing) that provide insights into market sentiment and can signal potential reversals or continuations.
Trend Analysis
Price action traders identify the market’s trend by observing the sequence of highs and lows. An uptrend is characterized by a series of higher highs and higher lows, while a downtrend is marked by lower highs and lower lows. A break in this sequence can indicate a potential trend reversal.
💰Quotes:
“Price action is the only truth on the chart.”
“Everything you need to know is written in the candles.”
“Indicators lag, price action leads.”
“Trade what you see, not what you think.”
“Every candle tells a story. Learn to read it.”
💰Quotes:
“Support and resistance are the footprints of money.”
“A closed candle is a fact, an open candle is only a possibility.”
“The market doesn’t hide; it leaves clues in price action.”
“The best trades look obvious… after you’ve learned to see them.”
“Patterns are just human emotions drawn on a chart.”
The Power of PriceAction
What is Price Action?!
Price action is a trading methodology that analyzes the movement of an asset’s price over time to make trading decisions. It is the foundation of technical analysis and operates on the principle that all relevant market information—including economic news, investor sentiment, and fundamental data—is already reflected in the asset’s price.
Instead of relying on lagging technical indicators, traders who use price action focus on a “naked” or clean chart. By observing historical price data, they identify patterns, trends, and key levels to predict future price direction.The core concepts of price action analysis include:Support and Resistance
These are price levels where an asset’s price has historically paused or reversed direction. A support level is a price floor where buying pressure is strong enough to prevent the price from falling further. A resistance level is a price ceiling where selling pressure is sufficient to stop the price from rising higher.
Candlestick Patterns
Candlestick charts are a primary tool for price action traders. Each candlestick represents a specific period and shows the open, high, low, and closing prices. The shape and color of the candlesticks form patterns (e.g., Doji, Hammer, Engulfing) that provide insights into market sentiment and can signal potential reversals or continuations.
Trend Analysis
Price action traders identify the market’s trend by observing the sequence of highs and lows. An uptrend is characterized by a series of higher highs and higher lows, while a downtrend is marked by lower highs and lower lows. A break in this sequence can indicate a potential trend reversal.
💰Quotes:
“Price action is the only truth on the chart.”
“Everything you need to know is written in the candles.”
“Indicators lag, price action leads.”
“Trade what you see, not what you think.”
“Every candle tells a story. Learn to read it.”
💰Quotes:
“Support and resistance are the footprints of money.”
“A closed candle is a fact, an open candle is only a possibility.”
“The market doesn’t hide; it leaves clues in price action.”
“The best trades look obvious… after you’ve learned to see them.”
“Patterns are just human emotions drawn on a chart.”
The Power of PriceAction
💰What in the Kraken’s Name is Price Action?
Imagine you’re on a bustling market street, and everyone’s shouting their prices for pineapples. You don’t need a fancy economist with a spreadsheet to tell you if pineapples are getting more popular or less. You just watch what people are doing: are they eagerly snatching them up at higher prices, or are the vendors struggling to give them away?
Price action is exactly that, but for stocks and other assets! It’s simply reading the story the market is telling you directly through the price itself. No need for complicated, lagging indicators that are always a step behind, like a tired parrot squawking old news. You’re looking at the raw, unfiltered moves on your chart – the ultimate truth of supply and demand, fear and greed.
💰Why is it the Golden Compass of Trading?
Forget trying to navigate with a half-broken sextant! Price action is your North Star, your most reliable guide:
It’s the OG (Original Gangster) Signal: Every indicator you see on a chart is derived from price. Price action is the price. It’s the source code, the main event, the real deal. When you’re looking at price action, you’re getting the news straight from the horse’s mouth, not through a dozen gossipy villagers.
No Lag, Just Action! Imagine trying to surf a wave by looking at where the last wave broke. You’d be wiped out! Many indicators are “lagging,” meaning they tell you what already happened. Price action is live, in the moment, allowing you to catch the wave as it forms. This means quicker decisions, tighter entries, and less time being swept away by unexpected currents.
Simpler Than a Coconut Cocktail: You don’t need a supercomputer or a massive collection of complex tools. A clean chart, your trusty eyeballs, and a basic understanding of candlestick patterns are often all you need. This simplicity reduces overwhelm and helps you make clear, decisive calls without second-guessing.
The Trend is Your Best Mate! Remember that wise old saying, “the trend is your friend”? Price action is the ultimate wingman for spotting that friend! It’s super easy to see if the market is clearly sailing upwards (making higher highs and higher lows), diving downwards (lower lows and lower highs), or just bobbing around in the doldrums. If the trend is clear, you know exactly which direction to point your ship. If it’s messy, price action tells you to stay ashore and enjoy a pineapple smoothie!
💰How to Read the Market’s Secret Diary (The Candlesticks!)
Each little candle on your chart is like a tiny scroll, telling you a mini-story of what happened during that time period (a minute, an hour, a day).
The Body: This is the fat part of the candle. A long green (or white) body means buyers were in control, pushing the price way up. A long red (or black) body means sellers dominated, sending the price tumbling. Think of it as a tug-of-war: who won that round?
The Wicks (or Shadows): These thin lines sticking out from the top and bottom are like antennae, showing you how far the price tried to go but got rejected. A long upper wick means buyers tried to push it high but sellers dragged it back down. A long lower wick means sellers tried to push it low but buyers bravely picked it up. These wicks often whisper secrets about exhaustion or reversals!
By watching how these candles form patterns – like a “Hammer” hitting rock bottom and bouncing back up (a sign of buyers coming to the rescue!), or an “Engulfing” pattern where one big candle swallows the previous one (a dramatic shift in power!) – you start to predict where the currents might take you next.
So, next time you’re charting your course, clear your deck, breathe in that salty air, and let the price action speak to you. It’s the most direct, most powerful, and frankly, the most fun way to understand what’s truly happening in the market and chart your way to potential success!
💰Quotes:
“Price action is the only truth on the chart.”
“Everything you need to know is written in the candles.”
“Indicators lag, price action leads.”
“Trade what you see, not what you think.”
“Every candle tells a story. Learn to read it.”
💰Quotes:
“Support and resistance are the footprints of money.”
“A closed candle is a fact, an open candle is only a possibility.”
“The market doesn’t hide; it leaves clues in price action.”
“The best trades look obvious… after you’ve learned to see them.”
“Patterns are just human emotions drawn on a chart.”
💰Quotes:
“Price action: the art of staring at candles until they confess.”
“Indicators are like rumors; price action is the witness.”
“Trading without price action is like driving blindfolded.”
“Sometimes the best trade is to just let the candle close.”
“If you can’t find the trend, step back and squint—price action is waving at you.”
💰Quotes:
“Enter the trade — then sit on your hands like a monk!”
“We don’t click and panic. We click and chill.”
“Traders who wait, get paid. Traders who fidget… donate!”
“We enter the trade, then do absolutely nothing like pros.”
“Let the market work. You’re not its boss.”
💰Quotes:
“Enter the trade — then sit on your hands like a monk!”
“We don’t click and panic. We click and chill.”
“Traders who wait, get paid. Traders who fidget… donate!”
“We enter the trade, then do absolutely nothing like pros.”
“Let the market work. You’re not its boss.”
💰Quotes:
“Enter the trade — then sit on your hands like a monk!”
“We don’t click and panic. We click and chill.”
“Traders who wait, get paid. Traders who fidget… donate!”
“We enter the trade, then do absolutely nothing like pros.”
“Let the market work. You’re not its boss.”
Add Your Heading Text Here
The Power of PriceAction
What is Price Action?!
Price action is a trading methodology that analyzes the movement of an asset’s price over time to make trading decisions. It is the foundation of technical analysis and operates on the principle that all relevant market information—including economic news, investor sentiment, and fundamental data—is already reflected in the asset’s price.
Instead of relying on lagging technical indicators, traders who use price action focus on a “naked” or clean chart. By observing historical price data, they identify patterns, trends, and key levels to predict future price direction.The core concepts of price action analysis include:Support and Resistance
These are price levels where an asset’s price has historically paused or reversed direction. A support level is a price floor where buying pressure is strong enough to prevent the price from falling further. A resistance level is a price ceiling where selling pressure is sufficient to stop the price from rising higher.
Candlestick Patterns
Candlestick charts are a primary tool for price action traders. Each candlestick represents a specific period and shows the open, high, low, and closing prices. The shape and color of the candlesticks form patterns (e.g., Doji, Hammer, Engulfing) that provide insights into market sentiment and can signal potential reversals or continuations.
Trend Analysis
Price action traders identify the market’s trend by observing the sequence of highs and lows. An uptrend is characterized by a series of higher highs and higher lows, while a downtrend is marked by lower highs and lower lows. A break in this sequence can indicate a potential trend reversal.
💰Quotes:
“Price action is the only truth on the chart.”
“Everything you need to know is written in the candles.”
“Indicators lag, price action leads.”
“Trade what you see, not what you think.”
“Every candle tells a story. Learn to read it.”
💰Quotes:
“Support and resistance are the footprints of money.”
“A closed candle is a fact, an open candle is only a possibility.”
“The market doesn’t hide; it leaves clues in price action.”
“The best trades look obvious… after you’ve learned to see them.”
“Patterns are just human emotions drawn on a chart.”
Price Action: From Chaos to Clarity
What is Price Action?!
Price action is a trading methodology that analyzes the movement of an asset’s price over time to make trading decisions. It is the foundation of technical analysis and operates on the principle that all relevant market information—including economic news, investor sentiment, and fundamental data—is already reflected in the asset’s price.
Instead of relying on lagging technical indicators, traders who use price action focus on a “naked” or clean chart. By observing historical price data, they identify patterns, trends, and key levels to predict future price direction.The core concepts of price action analysis include:Support and Resistance
These are price levels where an asset’s price has historically paused or reversed direction. A support level is a price floor where buying pressure is strong enough to prevent the price from falling further. A resistance level is a price ceiling where selling pressure is sufficient to stop the price from rising higher.
Candlestick Patterns
Candlestick charts are a primary tool for price action traders. Each candlestick represents a specific period and shows the open, high, low, and closing prices. The shape and color of the candlesticks form patterns (e.g., Doji, Hammer, Engulfing) that provide insights into market sentiment and can signal potential reversals or continuations.
Trend Analysis
Price action traders identify the market’s trend by observing the sequence of highs and lows. An uptrend is characterized by a series of higher highs and higher lows, while a downtrend is marked by lower highs and lower lows. A break in this sequence can indicate a potential trend reversal.
Price Action: From Chaos to Clarity
💰What in the Kraken’s Name is Price Action?
Imagine you’re on a bustling market street, and everyone’s shouting their prices for pineapples. You don’t need a fancy economist with a spreadsheet to tell you if pineapples are getting more popular or less. You just watch what people are doing: are they eagerly snatching them up at higher prices, or are the vendors struggling to give them away?
Price action is exactly that, but for stocks and other assets! It’s simply reading the story the market is telling you directly through the price itself. No need for complicated, lagging indicators that are always a step behind, like a tired parrot squawking old news. You’re looking at the raw, unfiltered moves on your chart – the ultimate truth of supply and demand, fear and greed.
💰Why is it the Golden Compass of Trading?
Forget trying to navigate with a half-broken sextant! Price action is your North Star, your most reliable guide:
It’s the OG (Original Gangster) Signal: Every indicator you see on a chart is derived from price. Price action is the price. It’s the source code, the main event, the real deal. When you’re looking at price action, you’re getting the news straight from the horse’s mouth, not through a dozen gossipy villagers.
No Lag, Just Action! Imagine trying to surf a wave by looking at where the last wave broke. You’d be wiped out! Many indicators are “lagging,” meaning they tell you what already happened. Price action is live, in the moment, allowing you to catch the wave as it forms. This means quicker decisions, tighter entries, and less time being swept away by unexpected currents.
Simpler Than a Coconut Cocktail: You don’t need a supercomputer or a massive collection of complex tools. A clean chart, your trusty eyeballs, and a basic understanding of candlestick patterns are often all you need. This simplicity reduces overwhelm and helps you make clear, decisive calls without second-guessing.
The Trend is Your Best Mate! Remember that wise old saying, “the trend is your friend”? Price action is the ultimate wingman for spotting that friend! It’s super easy to see if the market is clearly sailing upwards (making higher highs and higher lows), diving downwards (lower lows and lower highs), or just bobbing around in the doldrums. If the trend is clear, you know exactly which direction to point your ship. If it’s messy, price action tells you to stay ashore and enjoy a pineapple smoothie!
💰How to Read the Market’s Secret Diary (The Candlesticks!)
Each little candle on your chart is like a tiny scroll, telling you a mini-story of what happened during that time period (a minute, an hour, a day).
The Body: This is the fat part of the candle. A long green (or white) body means buyers were in control, pushing the price way up. A long red (or black) body means sellers dominated, sending the price tumbling. Think of it as a tug-of-war: who won that round?
The Wicks (or Shadows): These thin lines sticking out from the top and bottom are like antennae, showing you how far the price tried to go but got rejected. A long upper wick means buyers tried to push it high but sellers dragged it back down. A long lower wick means sellers tried to push it low but buyers bravely picked it up. These wicks often whisper secrets about exhaustion or reversals!
By watching how these candles form patterns – like a “Hammer” hitting rock bottom and bouncing back up (a sign of buyers coming to the rescue!), or an “Engulfing” pattern where one big candle swallows the previous one (a dramatic shift in power!) – you start to predict where the currents might take you next.
So, next time you’re charting your course, clear your deck, breathe in that salty air, and let the price action speak to you. It’s the most direct, most powerful, and frankly, the most fun way to understand what’s truly happening in the market and chart your way to potential success!
💰Quotes:
“Enter the trade — then sit on your hands like a monk!”
“We don’t click and panic. We click and chill.”
“Traders who wait, get paid. Traders who fidget… donate!”
“We enter the trade, then do absolutely nothing like pros.”
“Let the market work. You’re not its boss.”
💰Normal Tone Slogans:
“Enter with a plan, then let the trade play out.”
“The work is in the setup — the result comes with patience.”
“We don’t babysit trades. We trust our edge.”
“Entry is action. Waiting is discipline.”
“After entry, emotion has no place — only patience.”
Price Action: From Chaos to Clarity
💰What in the Kraken’s Name is Price Action?
Imagine you’re on a bustling market street, and everyone’s shouting their prices for pineapples. You don’t need a fancy economist with a spreadsheet to tell you if pineapples are getting more popular or less. You just watch what people are doing: are they eagerly snatching them up at higher prices, or are the vendors struggling to give them away?
Price action is exactly that, but for stocks and other assets! It’s simply reading the story the market is telling you directly through the price itself. No need for complicated, lagging indicators that are always a step behind, like a tired parrot squawking old news. You’re looking at the raw, unfiltered moves on your chart – the ultimate truth of supply and demand, fear and greed.
💰Why is it the Golden Compass of Trading?
Forget trying to navigate with a half-broken sextant! Price action is your North Star, your most reliable guide:
It’s the OG (Original Gangster) Signal: Every indicator you see on a chart is derived from price. Price action is the price. It’s the source code, the main event, the real deal. When you’re looking at price action, you’re getting the news straight from the horse’s mouth, not through a dozen gossipy villagers.
No Lag, Just Action! Imagine trying to surf a wave by looking at where the last wave broke. You’d be wiped out! Many indicators are “lagging,” meaning they tell you what already happened. Price action is live, in the moment, allowing you to catch the wave as it forms. This means quicker decisions, tighter entries, and less time being swept away by unexpected currents.
Simpler Than a Coconut Cocktail: You don’t need a supercomputer or a massive collection of complex tools. A clean chart, your trusty eyeballs, and a basic understanding of candlestick patterns are often all you need. This simplicity reduces overwhelm and helps you make clear, decisive calls without second-guessing.
The Trend is Your Best Mate! Remember that wise old saying, “the trend is your friend”? Price action is the ultimate wingman for spotting that friend! It’s super easy to see if the market is clearly sailing upwards (making higher highs and higher lows), diving downwards (lower lows and lower highs), or just bobbing around in the doldrums. If the trend is clear, you know exactly which direction to point your ship. If it’s messy, price action tells you to stay ashore and enjoy a pineapple smoothie!
💰How to Read the Market’s Secret Diary (The Candlesticks!)
Each little candle on your chart is like a tiny scroll, telling you a mini-story of what happened during that time period (a minute, an hour, a day).
The Body: This is the fat part of the candle. A long green (or white) body means buyers were in control, pushing the price way up. A long red (or black) body means sellers dominated, sending the price tumbling. Think of it as a tug-of-war: who won that round?
The Wicks (or Shadows): These thin lines sticking out from the top and bottom are like antennae, showing you how far the price tried to go but got rejected. A long upper wick means buyers tried to push it high but sellers dragged it back down. A long lower wick means sellers tried to push it low but buyers bravely picked it up. These wicks often whisper secrets about exhaustion or reversals!
By watching how these candles form patterns – like a “Hammer” hitting rock bottom and bouncing back up (a sign of buyers coming to the rescue!), or an “Engulfing” pattern where one big candle swallows the previous one (a dramatic shift in power!) – you start to predict where the currents might take you next.
So, next time you’re charting your course, clear your deck, breathe in that salty air, and let the price action speak to you. It’s the most direct, most powerful, and frankly, the most fun way to understand what’s truly happening in the market and chart your way to potential success!
💰Quotes:
-
“Enter the trade — then sit on your hands like a monk!”
-
“We don’t click and panic. We click and chill.”
-
“Traders who wait, get paid. Traders who fidget… donate!”
-
“We enter the trade, then do absolutely nothing like pros.”
-
“Let the market work. You’re not its boss.”
💰Quotes:
-
“Enter the trade — then sit on your hands like a monk!”
-
“We don’t click and panic. We click and chill.”
-
“Traders who wait, get paid. Traders who fidget… donate!”
-
“We enter the trade, then do absolutely nothing like pros.”
-
“Let the market work. You’re not its boss.”
Price Action: From Chaos to Clarity
💰Quotes:
“Enter the trade — then sit on your hands like a monk!”
“We don’t click and panic. We click and chill.”
“Traders who wait, get paid. Traders who fidget… donate!”
“We enter the trade, then do absolutely nothing like pros.”
“Let the market work. You’re not its boss.”
💰Normal Tone Slogans:
“Enter with a plan, then let the trade play out.”
“The work is in the setup — the result comes with patience.”
“We don’t babysit trades. We trust our edge.”
“Entry is action. Waiting is discipline.”
“After entry, emotion has no place — only patience.”
💰How to Read the Market’s Secret Diary (The Candlesticks!)
Each little candle on your chart is like a tiny scroll, telling you a mini-story of what happened during that time period (a minute, an hour, a day).
The Body: This is the fat part of the candle. A long green (or white) body means buyers were in control, pushing the price way up. A long red (or black) body means sellers dominated, sending the price tumbling. Think of it as a tug-of-war: who won that round?
The Wicks (or Shadows): These thin lines sticking out from the top and bottom are like antennae, showing you how far the price tried to go but got rejected. A long upper wick means buyers tried to push it high but sellers dragged it back down. A long lower wick means sellers tried to push it low but buyers bravely picked it up. These wicks often whisper secrets about exhaustion or reversals!
By watching how these candles form patterns – like a “Hammer” hitting rock bottom and bouncing back up (a sign of buyers coming to the rescue!), or an “Engulfing” pattern where one big candle swallows the previous one (a dramatic shift in power!) – you start to predict where the currents might take you next.
So, next time you’re charting your course, clear your deck, breathe in that salty air, and let the price action speak to you. It’s the most direct, most powerful, and frankly, the most fun way to understand what’s truly happening in the market and chart your way to potential success!
The Power of PriceAction
💰What in the Kraken’s Name is Price Action?
Imagine you’re on a bustling market street, and everyone’s shouting their prices for pineapples. You don’t need a fancy economist with a spreadsheet to tell you if pineapples are getting more popular or less. You just watch what people are doing: are they eagerly snatching them up at higher prices, or are the vendors struggling to give them away?
Price action is exactly that, but for stocks and other assets! It’s simply reading the story the market is telling you directly through the price itself. No need for complicated, lagging indicators that are always a step behind, like a tired parrot squawking old news. You’re looking at the raw, unfiltered moves on your chart – the ultimate truth of supply and demand, fear and greed.
💰Why is it the Golden Compass of Trading?
Forget trying to navigate with a half-broken sextant! Price action is your North Star, your most reliable guide:
It’s the OG (Original Gangster) Signal: Every indicator you see on a chart is derived from price. Price action is the price. It’s the source code, the main event, the real deal. When you’re looking at price action, you’re getting the news straight from the horse’s mouth, not through a dozen gossipy villagers.
No Lag, Just Action! Imagine trying to surf a wave by looking at where the last wave broke. You’d be wiped out! Many indicators are “lagging,” meaning they tell you what already happened. Price action is live, in the moment, allowing you to catch the wave as it forms. This means quicker decisions, tighter entries, and less time being swept away by unexpected currents.
Simpler Than a Coconut Cocktail: You don’t need a supercomputer or a massive collection of complex tools. A clean chart, your trusty eyeballs, and a basic understanding of candlestick patterns are often all you need. This simplicity reduces overwhelm and helps you make clear, decisive calls without second-guessing.
The Trend is Your Best Mate! Remember that wise old saying, “the trend is your friend”? Price action is the ultimate wingman for spotting that friend! It’s super easy to see if the market is clearly sailing upwards (making higher highs and higher lows), diving downwards (lower lows and lower highs), or just bobbing around in the doldrums. If the trend is clear, you know exactly which direction to point your ship. If it’s messy, price action tells you to stay ashore and enjoy a pineapple smoothie!
💰How to Read the Market’s Secret Diary (The Candlesticks!)
Each little candle on your chart is like a tiny scroll, telling you a mini-story of what happened during that time period (a minute, an hour, a day).
The Body: This is the fat part of the candle. A long green (or white) body means buyers were in control, pushing the price way up. A long red (or black) body means sellers dominated, sending the price tumbling. Think of it as a tug-of-war: who won that round?
The Wicks (or Shadows): These thin lines sticking out from the top and bottom are like antennae, showing you how far the price tried to go but got rejected. A long upper wick means buyers tried to push it high but sellers dragged it back down. A long lower wick means sellers tried to push it low but buyers bravely picked it up. These wicks often whisper secrets about exhaustion or reversals!
By watching how these candles form patterns – like a “Hammer” hitting rock bottom and bouncing back up (a sign of buyers coming to the rescue!), or an “Engulfing” pattern where one big candle swallows the previous one (a dramatic shift in power!) – you start to predict where the currents might take you next.
So, next time you’re charting your course, clear your deck, breathe in that salty air, and let the price action speak to you. It’s the most direct, most powerful, and frankly, the most fun way to understand what’s truly happening in the market and chart your way to potential success!
💰Quotes:
“Enter the trade — then sit on your hands like a monk!”
“We don’t click and panic. We click and chill.”
“Traders who wait, get paid. Traders who fidget… donate!”
“We enter the trade, then do absolutely nothing like pros.”
“Let the market work. You’re not its boss.”
💰Normal Tone Slogans:
“Enter with a plan, then let the trade play out.”
“The work is in the setup — the result comes with patience.”
“We don’t babysit trades. We trust our edge.”
“Entry is action. Waiting is discipline.”
“After entry, emotion has no place — only patience.”