The Story
The Story of Risk/Reward (RR)

- Is the current trend bullish or bearish?
2. Is the main trend bullish or bearish on selected timeframe?
3. Where is price now? where are the keylevels?
4. Are there any Price Action?
5. Are there any failed Price Action?
6. Is there evidence that the market is getting rid of buyers or sellers?
💰“The Power of Price Action”
Quotes:
“Let Price Tell the Story.”
“Price Never Lies – Everything Else Might.”
“Trade What You See, Not What You Think.”
“Candles Speak Louder Than Indicators.”
- “The Truth is in the Candles.”
The Ratio Renaissance: The Risk/Reward Story
Carl, known affectionately as “Calculus Carl” on the trading floor, was not driven by adrenaline. He was driven by arithmetic. Carl understood that trading wasn’t about winning every battle; it was about ensuring that when he did win, the payout far exceeded his cost of entry. His entire career was built on the gospel of the Risk/Reward Ratio.
“If you are only risking one dollar to make one dollar, you need to be right 51% of the time just to cover the cost of the trade,” Carl would preach, adjusting his glasses. “But if you risk one dollar to make three dollars, suddenly, you only need to be right 30% of the time. It’s an intellectual cheat code for longevity!” Carl always aimed for a minimum 1:3 Ratio.
Today, Carl was eyeing Nebula Nets (NETS). The chart showed a clear support level at $20.00 and a strong historical resistance at $23.00. Carl planned to enter at $20.10, placing his Stop-Loss at $19.90 (a 20-cent risk) and his Take-Profit at $22.70 (a $2.60 reward). His ratio was a spectacular 1:13.
“Pure genius,” he muttered, executing the order with the calm professionalism of a librarian filing a book.
Meanwhile, Spike, the floor’s resident gambler, was chasing a stock called Flash Foods (FLSH). FLSH was already up 50% in a week, and Spike decided to jump in at $10.00, placing a stop-loss at $9.50 (50 cents of risk) and a take-profit at $10.25 (only 25 cents of potential reward).
“I’m just catching the momentum, Carl! Look at this chart—it’s going to hit $12!” Spike yelled, ignoring the fact that his Risk/Reward was an abysmal 2:1. He was risking twice as much as he stood to gain. It was the trading equivalent of driving 100 miles for a penny.
FLSH, of course, immediately reversed and hit Spike’s stop-loss, costing him a clean 50 cents. “Bad luck!” Spike wailed.
Carl just shook his head. “Not luck, Spike. Bad math.” An hour later, NETS, after testing its support, blasted through the $21 and $22 marks. Carl’s Take-Profit hit $22.70, securing $2.60 in profit.
Carl’s success was exciting not because it was dramatic, but because it was guaranteed to work over the long run. He happily took his $2.60 gain, knowing that his discipline allowed him to absorb twelve losses before being down even one penny against his win. The true thrill of trading, Carl concluded, is watching simple math trounce raw emotion.

The Story of Risk/Reward (RR)


The Story of the Chart
The Story of the Chart


- Is the current trend bullish or bearish?
2. Is the main trend bullish or bearish on selected timeframe?
3. Where is price now? where are the keylevels?
4. Are there any Price Action?
5. Are there any failed Price Action?
6. Is there evidence that the market is getting rid of buyers or sellers?
💰“The Power of Price Action”
Quotes:
“Let Price Tell the Story.”
“Price Never Lies – Everything Else Might.”
“Trade What You See, Not What You Think.”
“Candles Speak Louder Than Indicators.”
- “The Truth is in the Candles.”
The Story of the Chart


The Story of the Chart


The Story of the Chart


The Story of the Chart


Lorem ipsum dolor sit amet, consectetur adipiscing elit. Ut elit tellus, luctus nec ullamcorper mattis, pulvinar dapibus leo.
The Story of the Chart


The Story of the Chart


The Story of the Chart


The Story of the Chart


The Story of the Trend

- Is the current trend bullish or bearish?
2. Is the main trend bullish or bearish on selected timeframe?
3. Where is price now? where are the keylevels?
4. Are there any Price Action?
5. Are there any failed Price Action?
6. Is there evidence that the market is getting rid of buyers or sellers?
💰“The Power of Price Action”
Quotes:
“Let Price Tell the Story.”
“Price Never Lies – Everything Else Might.”
“Trade What You See, Not What You Think.”
“Candles Speak Louder Than Indicators.”
- “The Truth is in the Candles.”
The Ratio Renaissance: The Risk/Reward Story
Carl, known affectionately as “Calculus Carl” on the trading floor, was not driven by adrenaline. He was driven by arithmetic. Carl understood that trading wasn’t about winning every battle; it was about ensuring that when he did win, the payout far exceeded his cost of entry. His entire career was built on the gospel of the Risk/Reward Ratio.
“If you are only risking one dollar to make one dollar, you need to be right 51% of the time just to cover the cost of the trade,” Carl would preach, adjusting his glasses. “But if you risk one dollar to make three dollars, suddenly, you only need to be right 30% of the time. It’s an intellectual cheat code for longevity!” Carl always aimed for a minimum 1:3 Ratio.
Today, Carl was eyeing Nebula Nets (NETS). The chart showed a clear support level at $20.00 and a strong historical resistance at $23.00. Carl planned to enter at $20.10, placing his Stop-Loss at $19.90 (a 20-cent risk) and his Take-Profit at $22.70 (a $2.60 reward). His ratio was a spectacular 1:13.
“Pure genius,” he muttered, executing the order with the calm professionalism of a librarian filing a book.
Meanwhile, Spike, the floor’s resident gambler, was chasing a stock called Flash Foods (FLSH). FLSH was already up 50% in a week, and Spike decided to jump in at $10.00, placing a stop-loss at $9.50 (50 cents of risk) and a take-profit at $10.25 (only 25 cents of potential reward).
“I’m just catching the momentum, Carl! Look at this chart—it’s going to hit $12!” Spike yelled, ignoring the fact that his Risk/Reward was an abysmal 2:1. He was risking twice as much as he stood to gain. It was the trading equivalent of driving 100 miles for a penny.
FLSH, of course, immediately reversed and hit Spike’s stop-loss, costing him a clean 50 cents. “Bad luck!” Spike wailed.
Carl just shook his head. “Not luck, Spike. Bad math.” An hour later, NETS, after testing its support, blasted through the $21 and $22 marks. Carl’s Take-Profit hit $22.70, securing $2.60 in profit.
Carl’s success was exciting not because it was dramatic, but because it was guaranteed to work over the long run. He happily took his $2.60 gain, knowing that his discipline allowed him to absorb twelve losses before being down even one penny against his win. The true thrill of trading, Carl concluded, is watching simple math trounce raw emotion.

The Story

The Story of the Risk/Reward


The Story of Risk/Reward (RR)


- Is the current trend bullish or bearish?
2. Is the main trend bullish or bearish on selected timeframe?
3. Where is price now? where are the keylevels?
4. Are there any Price Action?
5. Are there any failed Price Action?
6. Is there evidence that the market is getting rid of buyers or sellers?
💰“The Power of Price Action”
Quotes:
“Let Price Tell the Story.”
“Price Never Lies – Everything Else Might.”
“Trade What You See, Not What You Think.”
“Candles Speak Louder Than Indicators.”
- “The Truth is in the Candles.”
The Ratio Renaissance: The Risk/Reward Story
Carl, known affectionately as “Calculus Carl” on the trading floor, was not driven by adrenaline. He was driven by arithmetic. Carl understood that trading wasn’t about winning every battle; it was about ensuring that when he did win, the payout far exceeded his cost of entry. His entire career was built on the gospel of the Risk/Reward Ratio.
“If you are only risking one dollar to make one dollar, you need to be right 51% of the time just to cover the cost of the trade,” Carl would preach, adjusting his glasses. “But if you risk one dollar to make three dollars, suddenly, you only need to be right 30% of the time. It’s an intellectual cheat code for longevity!” Carl always aimed for a minimum 1:3 Ratio.
Today, Carl was eyeing Nebula Nets (NETS). The chart showed a clear support level at $20.00 and a strong historical resistance at $23.00. Carl planned to enter at $20.10, placing his Stop-Loss at $19.90 (a 20-cent risk) and his Take-Profit at $22.70 (a $2.60 reward). His ratio was a spectacular 1:13.
“Pure genius,” he muttered, executing the order with the calm professionalism of a librarian filing a book.
Meanwhile, Spike, the floor’s resident gambler, was chasing a stock called Flash Foods (FLSH). FLSH was already up 50% in a week, and Spike decided to jump in at $10.00, placing a stop-loss at $9.50 (50 cents of risk) and a take-profit at $10.25 (only 25 cents of potential reward).
“I’m just catching the momentum, Carl! Look at this chart—it’s going to hit $12!” Spike yelled, ignoring the fact that his Risk/Reward was an abysmal 2:1. He was risking twice as much as he stood to gain. It was the trading equivalent of driving 100 miles for a penny.
FLSH, of course, immediately reversed and hit Spike’s stop-loss, costing him a clean 50 cents. “Bad luck!” Spike wailed.
Carl just shook his head. “Not luck, Spike. Bad math.” An hour later, NETS, after testing its support, blasted through the $21 and $22 marks. Carl’s Take-Profit hit $22.70, securing $2.60 in profit.
Carl’s success was exciting not because it was dramatic, but because it was guaranteed to work over the long run. He happily took his $2.60 gain, knowing that his discipline allowed him to absorb twelve losses before being down even one penny against his win. The true thrill of trading, Carl concluded, is watching simple math trounce raw emotion.
The Story of the Risk/Reward

- Is the current trend bullish or bearish?
2. Is the main trend bullish or bearish on selected timeframe?
3. Where is price now? where are the keylevels?
4. Are there any Price Action?
5. Are there any failed Price Action?
6. Is there evidence that the market is getting rid of buyers or sellers?
💰“The Power of Price Action”
Quotes:
“Let Price Tell the Story.”
“Price Never Lies – Everything Else Might.”
“Trade What You See, Not What You Think.”
“Candles Speak Louder Than Indicators.”
- “The Truth is in the Candles.”
The Ratio Renaissance: The Risk/Reward Story
Carl, known affectionately as “Calculus Carl” on the trading floor, was not driven by adrenaline. He was driven by arithmetic. Carl understood that trading wasn’t about winning every battle; it was about ensuring that when he did win, the payout far exceeded his cost of entry. His entire career was built on the gospel of the Risk/Reward Ratio.
“If you are only risking one dollar to make one dollar, you need to be right 51% of the time just to cover the cost of the trade,” Carl would preach, adjusting his glasses. “But if you risk one dollar to make three dollars, suddenly, you only need to be right 30% of the time. It’s an intellectual cheat code for longevity!” Carl always aimed for a minimum 1:3 Ratio.
Today, Carl was eyeing Nebula Nets (NETS). The chart showed a clear support level at $20.00 and a strong historical resistance at $23.00. Carl planned to enter at $20.10, placing his Stop-Loss at $19.90 (a 20-cent risk) and his Take-Profit at $22.70 (a $2.60 reward). His ratio was a spectacular 1:13.
“Pure genius,” he muttered, executing the order with the calm professionalism of a librarian filing a book.
Meanwhile, Spike, the floor’s resident gambler, was chasing a stock called Flash Foods (FLSH). FLSH was already up 50% in a week, and Spike decided to jump in at $10.00, placing a stop-loss at $9.50 (50 cents of risk) and a take-profit at $10.25 (only 25 cents of potential reward).
“I’m just catching the momentum, Carl! Look at this chart—it’s going to hit $12!” Spike yelled, ignoring the fact that his Risk/Reward was an abysmal 2:1. He was risking twice as much as he stood to gain. It was the trading equivalent of driving 100 miles for a penny.
FLSH, of course, immediately reversed and hit Spike’s stop-loss, costing him a clean 50 cents. “Bad luck!” Spike wailed.
Carl just shook his head. “Not luck, Spike. Bad math.” An hour later, NETS, after testing its support, blasted through the $21 and $22 marks. Carl’s Take-Profit hit $22.70, securing $2.60 in profit.
Carl’s success was exciting not because it was dramatic, but because it was guaranteed to work over the long run. He happily took his $2.60 gain, knowing that his discipline allowed him to absorb twelve losses before being down even one penny against his win. The true thrill of trading, Carl concluded, is watching simple math trounce raw emotion.


The Story of the Chart


The Ratio Renaissance: The Risk/Reward Story
Carl, known affectionately as “Calculus Carl” on the trading floor, was not driven by adrenaline. He was driven by arithmetic. Carl understood that trading wasn’t about winning every battle; it was about ensuring that when he did win, the payout far exceeded his cost of entry. His entire career was built on the gospel of the Risk/Reward Ratio.
“If you are only risking one dollar to make one dollar, you need to be right 51% of the time just to cover the cost of the trade,” Carl would preach, adjusting his glasses. “But if you risk one dollar to make three dollars, suddenly, you only need to be right 30% of the time. It’s an intellectual cheat code for longevity!” Carl always aimed for a minimum 1:3 Ratio.
Today, Carl was eyeing Nebula Nets (NETS). The chart showed a clear support level at $20.00 and a strong historical resistance at $23.00. Carl planned to enter at $20.10, placing his Stop-Loss at $19.90 (a 20-cent risk) and his Take-Profit at $22.70 (a $2.60 reward). His ratio was a spectacular 1:13.
“Pure genius,” he muttered, executing the order with the calm professionalism of a librarian filing a book.
Meanwhile, Spike, the floor’s resident gambler, was chasing a stock called Flash Foods (FLSH). FLSH was already up 50% in a week, and Spike decided to jump in at $10.00, placing a stop-loss at $9.50 (50 cents of risk) and a take-profit at $10.25 (only 25 cents of potential reward).
“I’m just catching the momentum, Carl! Look at this chart—it’s going to hit $12!” Spike yelled, ignoring the fact that his Risk/Reward was an abysmal 2:1. He was risking twice as much as he stood to gain. It was the trading equivalent of driving 100 miles for a penny.
FLSH, of course, immediately reversed and hit Spike’s stop-loss, costing him a clean 50 cents. “Bad luck!” Spike wailed.
Carl just shook his head. “Not luck, Spike. Bad math.” An hour later, NETS, after testing its support, blasted through the $21 and $22 marks. Carl’s Take-Profit hit $22.70, securing $2.60 in profit.
Carl’s success was exciting not because it was dramatic, but because it was guaranteed to work over the long run. He happily took his $2.60 gain, knowing that his discipline allowed him to absorb twelve losses before being down even one penny against his win. The true thrill of trading, Carl concluded, is watching simple math trounce raw emotion.
The Story of the Stop Loss


- Is the current trend bullish or bearish?
2. Is the main trend bullish or bearish on selected timeframe?
3. Where is price now? where are the keylevels?
4. Are there any Price Action?
5. Are there any failed Price Action?
6. Is there evidence that the market is getting rid of buyers or sellers?
💰“The Power of Price Action”
Quotes:
“Let Price Tell the Story.”
“Price Never Lies – Everything Else Might.”
“Trade What You See, Not What You Think.”
“Candles Speak Louder Than Indicators.”
- “The Truth is in the Candles.”
The Ratio Renaissance: The Risk/Reward Story
Carl, known affectionately as “Calculus Carl” on the trading floor, was not driven by adrenaline. He was driven by arithmetic. Carl understood that trading wasn’t about winning every battle; it was about ensuring that when he did win, the payout far exceeded his cost of entry. His entire career was built on the gospel of the Risk/Reward Ratio.
“If you are only risking one dollar to make one dollar, you need to be right 51% of the time just to cover the cost of the trade,” Carl would preach, adjusting his glasses. “But if you risk one dollar to make three dollars, suddenly, you only need to be right 30% of the time. It’s an intellectual cheat code for longevity!” Carl always aimed for a minimum 1:3 Ratio.
Today, Carl was eyeing Nebula Nets (NETS). The chart showed a clear support level at $20.00 and a strong historical resistance at $23.00. Carl planned to enter at $20.10, placing his Stop-Loss at $19.90 (a 20-cent risk) and his Take-Profit at $22.70 (a $2.60 reward). His ratio was a spectacular 1:13.
“Pure genius,” he muttered, executing the order with the calm professionalism of a librarian filing a book.
Meanwhile, Spike, the floor’s resident gambler, was chasing a stock called Flash Foods (FLSH). FLSH was already up 50% in a week, and Spike decided to jump in at $10.00, placing a stop-loss at $9.50 (50 cents of risk) and a take-profit at $10.25 (only 25 cents of potential reward).
“I’m just catching the momentum, Carl! Look at this chart—it’s going to hit $12!” Spike yelled, ignoring the fact that his Risk/Reward was an abysmal 2:1. He was risking twice as much as he stood to gain. It was the trading equivalent of driving 100 miles for a penny.
FLSH, of course, immediately reversed and hit Spike’s stop-loss, costing him a clean 50 cents. “Bad luck!” Spike wailed.
Carl just shook his head. “Not luck, Spike. Bad math.” An hour later, NETS, after testing its support, blasted through the $21 and $22 marks. Carl’s Take-Profit hit $22.70, securing $2.60 in profit.
Carl’s success was exciting not because it was dramatic, but because it was guaranteed to work over the long run. He happily took his $2.60 gain, knowing that his discipline allowed him to absorb twelve losses before being down even one penny against his win. The true thrill of trading, Carl concluded, is watching simple math trounce raw emotion.


The Story of the Trend


- Is the current trend bullish or bearish?
2. Is the main trend bullish or bearish on selected timeframe?
3. Where is price now? where are the keylevels?
4. Are there any Price Action?
5. Are there any failed Price Action?
6. Is there evidence that the market is getting rid of buyers or sellers?
💰“The Power of Price Action”
Quotes:
“Let Price Tell the Story.”
“Price Never Lies – Everything Else Might.”
“Trade What You See, Not What You Think.”
“Candles Speak Louder Than Indicators.”
- “The Truth is in the Candles.”
“The story of The Trend”
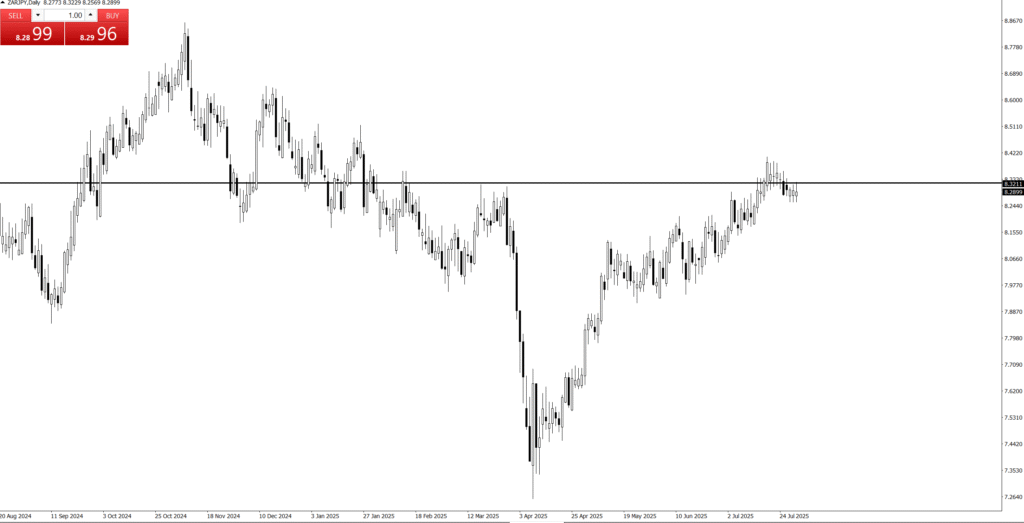
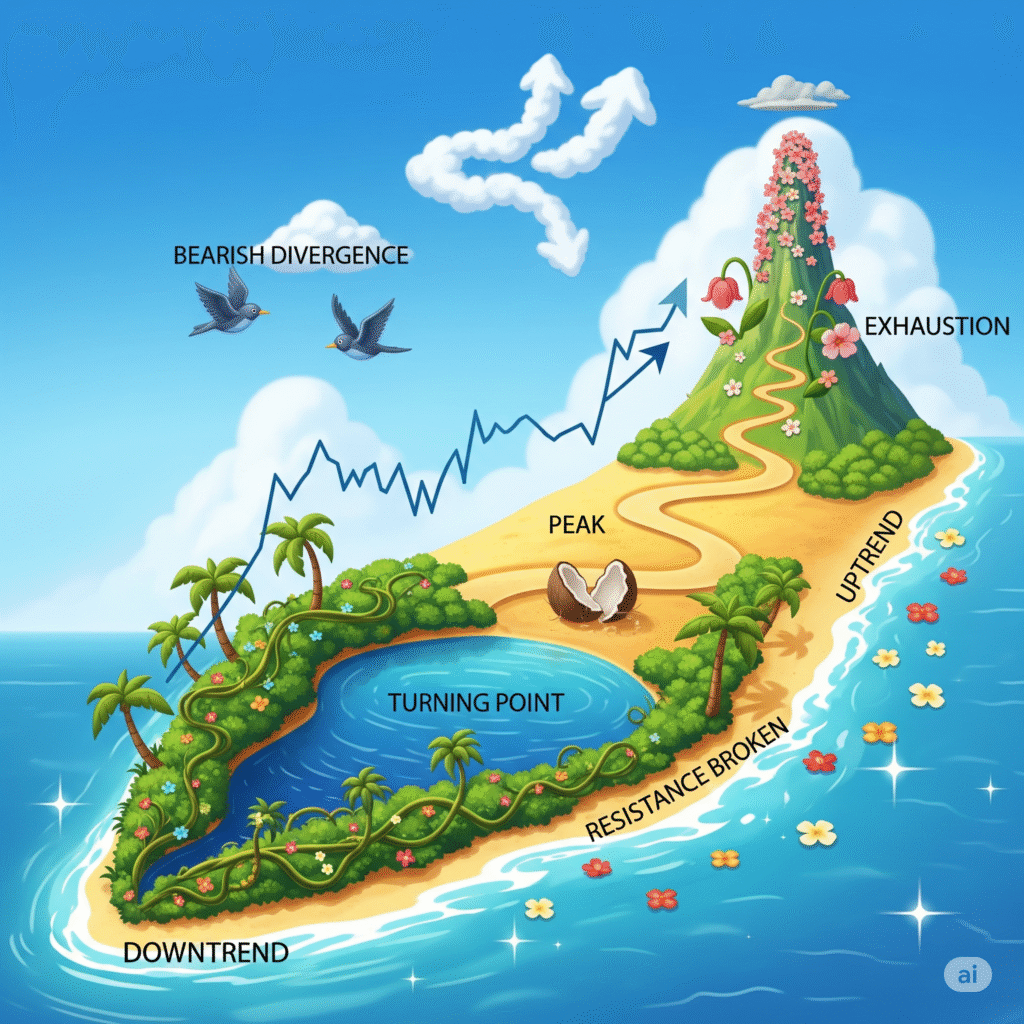
refers to the narrative or sequence of events that the price movement of a financial asset tells over a specific period, as depicted visually on a chart.
It’s an interpretive way of understanding market dynamics by observing:
Who’s in control: Are buyers (bulls) dominant, driving prices up? Or are sellers (bears) in charge, pushing prices down?
Key turning points: Where did the sentiment shift? Where did prices reverse, consolidate, or accelerate?
Areas of strength and weakness: At what price levels did the asset find support (a floor) or resistance (a ceiling)?
Market psychology: The patterns formed by the candlesticks (or bars) and their wicks (shadows) reflect the collective emotions and decisions of market participants—fear, greed, indecision, conviction, and panic.
Instead of relying on mathematical indicators (like moving averages, RSI, MACD) to filter or interpret the price, price action analysis focuses on the raw price data itself. Each candlestick (or bar) is seen as a “message” from the market, telling you what happened during that specific time interval (e.g., 5 minutes, 1 hour, 1 day).
So, when someone asks for “the story of the price action chart,” they’re asking for:
A historical account: What has the price done?
An analysis of supply and demand: Where did buyers step in? Where did sellers dominate?
Identification of patterns: Are there recurring shapes or behaviors that suggest future possibilities?
A qualitative understanding: Beyond just numbers, what does the visual pattern feel like in terms of market sentiment?
In essence, it’s about reading the chart directly, like a book, to understand the market’s past behavior and infer its potential future trajectory based on pure price movements.


The Story of the Trend


- Is the current trend bullish or bearish?
2. Is the main trend bullish or bearish on selected timeframe?
3. Where is price now? where are the keylevels?
4. Are there any Price Action?
5. Are there any failed Price Action?
6. Is there evidence that the market is getting rid of buyers or sellers?
💰“The Power of Price Action”
Quotes:
“Let Price Tell the Story.”
“Price Never Lies – Everything Else Might.”
“Trade What You See, Not What You Think.”
“Candles Speak Louder Than Indicators.”
- “The Truth is in the Candles.”
The Momentum Midas: Riding the Trend
Miles, an analyst with the patience of a geologist and the eyes of an eagle, was the anti-hero of his trading floor. While others frantically chased volatile micro-movements, Miles sat back, studying his screens like a cartographer mapping out a continent. His mantra was simple, profound, and utterly boring to novices: “The trend is your friend, until it bends.”
Miles was a dedicated trend follower. He wasn’t interested in day-to-day noise; he sought the primary direction, the great market river that flowed for months. His professional excitement came not from speed, but from scale. A major trend, once established, provided a sustained, predictable move—the market equivalent of a long, smooth flight after surviving the turbulence of takeoff.
His current conquest was Fusion Farms (FF), a company that had unexpectedly perfected vertical-farmed blueberries. For months, FF had languished, but recently, the 200-day Moving Average had straightened and turned upward, confirming a strong, new uptrend.
“They say ‘buy low, sell high,’ but I say ‘buy high, sell higher,'” Miles quipped to a colleague who was hyperventilating over a small dip. This dip, technically a pullback or correction, was causing widespread panic. The stock fell 5%, and the quick-money traders were sprinting for the exits.
Miles, however, remained serene. He confirmed that the price was merely touching the support of the established moving average—it was resting, not reversing. “The river hasn’t changed course; it’s just hit a small rock,” he murmured, professionally executing a buy order. This calculated entry was his favorite move: entering a strong trend during a temporary, fear-driven correction.
Over the next six weeks, Fusion Farms delivered. The overall momentum proved too powerful for the temporary fears, and the stock resumed its climb, carrying Miles’s position effortlessly. He closed the trade when his chart indicated the momentum was finally losing steam and the trend lines began to flatten—a professional, dispassionate exit that locked in a substantial gain.
Trend trading isn’t about being first; it’s about being right, consistently. It’s about leveraging the enormous, persistent force of market psychology. Day traders get headaches; swing traders get stomach ulcers; but trend followers? They enjoy a calm, smooth ride to the bank. It turns out, letting the market tell you where to go is the easiest way to travel.
