- Is the current trend bullish or bearish?
2. Is the main trend bullish or bearish on selected timeframe?
3. Where is price now? where are the keylevels?
4. Are there any Price Action?
5. Are there any failed Price Action?
6. Is there evidence that the market is getting rid of buyers or sellers?
💰
Okay, “the trend is your friend” is a classic trading adage that reinforces the principle we just discussed: always trade with the prevailing direction of the market. When you look at a chart with this philosophy in mind, the very first thing you’re trying to establish is: “Is there a clear, discernible ‘friend’ (trend) on this chart that I can follow?”
It’s not just about identifying a trend, but a clear one, because your “friend” needs to be reliable. If the “friend” is wishy-washy, jumping all over the place, it’s not a reliable companion for a trade. Here’s how to think about what you’re looking for immediately:
Account StopLoss Vs. Account No StopLoss
Let’s paint a picture of how aiming to double your €10,000 to €20,000 (or even €10,000,000 to €20,000,000!) with seemingly great 1:2 or 1:3 risk-reward ratios can spectacularly backfire when you ditch that crucial stop loss.
The core problem is this: your “intended risk” for a 1:2 or 1:3 setup is a lovely theory until reality (and an unmanaged market) decides to have a laugh at your expense. Without a stop loss, that “1” in your risk-reward ratio is, well, it’s a lie. Your actual risk is unlimited.
Here’s how it can go horribly, tragically wrong:
Let’s assume you’re starting with €10,000 and your goal is €20,000.
Scenario 1: The “Just A Little Bit More” Trap (1:2 or 1:3 R:R Gone Wild)
You’ve analyzed your chart, found a perfect setup. You plan to risk €100 (1% of your €10,000) for a €200 (1:2) or €300 (1:3) profit target. Sounds great, right?
The Trade Starts to Go Sour (The “Testing Phase”): You enter your long trade. The price drops slightly, hitting your intended €100 risk point.
No Stop Loss Kicks In (The “Hope” Phase): Because you have no stop loss, your position isn’t closed. Your brain kicks into gear: “It’s just testing previous support! It’ll bounce back! I don’t want to get whipsawed!”
The Price Keeps Dropping (The “Denial” Phase): The price doesn’t bounce. It keeps going down. Your €100 theoretical loss becomes €200, then €300. You start sweating. “Okay, now it has to bounce. It’s oversold!”
The “Mental Stop” Fails (The “Panic” Phase): Your “mental stop” (that invisible line in your head where you said you’d exit) is now a distant memory, a quaint notion from a saner time. The loss is now €500… €800… €1,000 (10% of your account!). You’re paralyzed by fear, hoping for a miracle bounce that never comes.
The Capital Shredding: One bad trade, where you refuse to accept a small loss, turns into a €2,000 loss. Your €10,000 is now €8,000.
The Math of Despair: To get back to €10,000, you now need to make a 25% profit (€2,000 / €8,000). To reach your ultimate goal of €20,000, you now need to double your remaining €8,000 to €16,000, and then make another €4,000 on top of that. One unmanaged loss didn’t just prevent you from doubling; it pushed your target further away and made the climb steeper.
Scenario 2: The “Death by a Thousand Paper Cuts” (A Series of Uncut Losses)
This isn’t one huge blow, but a slow, agonizing bleed.
You make a trade, it goes against you by €150. “Meh, it’ll turn around.” You don’t cut it.
You open another trade. It goes against you by €120. “Just a small drawdown.” You don’t cut it.
You have 5-7 open positions, all showing small-to-medium unrealized losses (€100, €150, €200, €300, €50). Suddenly, you realize €1,000 – €1,500 of your €10,000 capital is now tied up in losing trades.
The “Capital Imprisonment”: That €1,000+ isn’t just a loss; it’s imprisoned capital. You can’t use it for new, potentially good setups because it’s stuck waiting for a recovery that might never come. Your effective trading capital is severely diminished.
The Psychological Toll: You’re constantly monitoring these red positions, hoping they turn green, instead of focusing on new opportunities. Your mental bandwidth is consumed by “managing” these losing trades, leading to missed opportunities and poor decisions on new ones. Even if one recovers, another might plunge further.
Scenario 3: The Black Swan (The “Holy Moly, What Just Happened?” Moment)
This is the nightmare scenario that keeps professional traders awake at night, even with stops in place (though stops limit the damage).
You’re in a trade, perhaps long XYZ stock, thinking it’s heading for your 1:2 or 1:3 profit target. No stop loss, naturally.
Overnight, some unexpected news hits: a CEO resigns amid scandal, a company reports massive losses, a natural disaster, a geopolitical crisis.
The Market Gaps Down: The next morning, XYZ stock doesn’t open where it closed. It opens 20% lower, gapping straight over where your stop loss would have been (if you had one!).
Instant Devastation: Your €10,000 account might instantly be down €2,000-€3,000 or more on that single position, depending on your position size. Your “intended risk” of €100 is now a distant, laughable memory. You are now miles away from your €20,000 goal, facing an uphill battle just to get back to breakeven.
In all these scenarios, your planned 1:2 or 1:3 risk-reward ratios become utterly meaningless because the “risk” component is not enforced. Without a stop loss, you’re not trading with a disciplined edge; you’re playing Russian roulette with your capital, hoping the market is kind. And as anyone who’s ever faced a rogue trend knows, the market is rarely kind to the unprepared.
💰Quotes:
“Enter the trade — then sit on your hands like a monk!”
“We don’t click and panic. We click and chill.”
“Traders who wait, get paid. Traders who fidget… donate!”
“We enter the trade, then do absolutely nothing like pros.”
“Let the market work. You’re not its boss.”
💰Normal Tone Slogans:
“Enter with a plan, then let the trade play out.”
“The work is in the setup — the result comes with patience.”
“We don’t babysit trades. We trust our edge.”
“Entry is action. Waiting is discipline.”
“After entry, emotion has no place — only patience.”

Doubling your capital from €10,000 to €20,000 using positive risk-reward ratios like 1:2 or 1:3 is absolutely achievable, but it requires discipline, consistency, and, crucially, strict adherence to your predefined risk (meaning using stop losses for every trade!).
The beauty of a positive risk-reward ratio is that you don’t need to win every trade (or even most trades) to be profitable.
Let’s look at examples, assuming a starting capital of €10,000 and aiming for €20,000. We’ll assume you risk 1% of your current capital per trade. This means your nominal risk amount increases as your account grows, which is a common and powerful way to compound returns.
Example 1: Doubling with a 1:2 Risk-Reward Ratio
Your Plan: For every €1 you risk, you aim to make €2.
Risk per trade: 1% of your capital.
Reward per winning trade: 2% of your capital.
Loss per losing trade: 1% of your capital.
Let’s assume a 50% win rate (you win half your trades, lose half).
Hypothetical Trade Sequence (starting at €10,000):
Trade 1: Win! (+2% of €10,000 = €200). Capital: €10,200
Trade 2: Loss! (-1% of €10,200 = €102). Capital: €10,098
Trade 3: Win! (+2% of €10,098 = €201.96). Capital: €10,300
Trade 4: Loss! (-1% of €10,300 = €103). Capital: €10,197
Trade 5: Win! (+2% of €10,197 = €203.94). Capital: €10,401 …and so on…
The Math Over Time: For every 10 trades, with a 50% win rate:
5 Wins: 5 x (2% of capital) = +10% of capital
5 Losses: 5 x (1% of capital) = -5% of capital
Net Gain: +5% of capital for every 10 trades.
To double €10,000 to €20,000, you need to make approximately 100% net profit. Since you’re making about 5% per cycle of 10 trades, you’d need roughly 20 cycles of 10 trades (200 trades total) to reach your goal, assuming this consistent compounding and win rate.
After ~10 trades (5 wins, 5 losses): Capital is ~€10,500
After ~20 trades: Capital is ~€11,025
…This compounding effect accelerates as your capital grows.
The Story: Slow, steady, and disciplined wins over time. You take your small losses as they come, knowing that your winners are twice as big, allowing your equity curve to gradually climb towards your €20,000 target. It’s a marathon, not a sprint, but the numbers consistently work in your favor.
Example 2: Doubling with a 1:3 Risk-Reward Ratio
Your Plan: For every €1 you risk, you aim to make €3.
Risk per trade: 1% of your capital.
Reward per winning trade: 3% of your capital.
Loss per losing trade: 1% of your capital.
Let’s assume a slightly lower, but still common, 40% win rate (you win 4 out of 10 trades).
Hypothetical Trade Sequence (starting at €10,000):
Trade 1: Win! (+3% of €10,000 = €300). Capital: €10,300
Trade 2: Loss! (-1% of €10,300 = €103). Capital: €10,197
Trade 3: Loss! (-1% of €10,197 = €101.97). Capital: €10,095
Trade 4: Win! (+3% of €10,095 = €302.85). Capital: €10,398 …and so on…
The Math Over Time: For every 10 trades, with a 40% win rate:
4 Wins: 4 x (3% of capital) = +12% of capital
6 Losses: 6 x (1% of capital) = -6% of capital
Net Gain: +6% of capital for every 10 trades.
Even with a lower win rate, your higher risk-reward ratio means you’re still net positive! To double from €10,000 to €20,000 (100% net profit), you’d need roughly 17 cycles of 10 trades (170 trades total).
The Story: This approach is about seeking out those less frequent, but more impactful, home runs. You’re accepting more small losses, but when you win, you win big enough to cover those losses and then some. It requires more patience to wait for those higher reward setups and mental fortitude to endure more consecutive losses, but the compounding effect can be even faster.
Key Takeaways for Doubling Your Capital:
Consistency is King: It’s not about one huge win, but consistently applying your strategy and risk management.
Compounding Power: As your capital grows, the absolute value of your 1% risk and 2% or 3% reward also grows, accelerating your journey.
Discipline with Stop Losses: Crucially, for these risk-reward ratios to mean anything, you must use a stop loss on every trade. If you let a single loss run uncontrolled, it can easily wipe out weeks or months of consistent gains and derail your entire doubling goal. The “risk” in “risk-reward” is only valid if that risk is strictly enforced.

💰Quotes:
“Enter the trade — then sit on your hands like a monk!”
“We don’t click and panic. We click and chill.”
“Traders who wait, get paid. Traders who fidget… donate!”
“We enter the trade, then do absolutely nothing like pros.”
“Let the market work. You’re not its boss.”
💰Normal Tone Slogans:
“Enter with a plan, then let the trade play out.”
“The work is in the setup — the result comes with patience.”
“We don’t babysit trades. We trust our edge.”
“Entry is action. Waiting is discipline.”
“After entry, emotion has no place — only patience.”
Doubling your capital from €10,000 to €20,000 using positive risk-reward ratios like 1:2 or 1:3 is absolutely achievable, but it requires discipline, consistency, and, crucially, strict adherence to your predefined risk (meaning using stop losses for every trade!).
The beauty of a positive risk-reward ratio is that you don’t need to win every trade (or even most trades) to be profitable.
Let’s look at examples, assuming a starting capital of €10,000 and aiming for €20,000. We’ll assume you risk 1% of your current capital per trade. This means your nominal risk amount increases as your account grows, which is a common and powerful way to compound returns.
Example 1: Doubling with a 1:2 Risk-Reward Ratio
Your Plan: For every €1 you risk, you aim to make €2.
Risk per trade: 1% of your capital.
Reward per winning trade: 2% of your capital.
Loss per losing trade: 1% of your capital.
Let’s assume a 50% win rate (you win half your trades, lose half).
Hypothetical Trade Sequence (starting at €10,000):
Trade 1: Win! (+2% of €10,000 = €200). Capital: €10,200
Trade 2: Loss! (-1% of €10,200 = €102). Capital: €10,098
Trade 3: Win! (+2% of €10,098 = €201.96). Capital: €10,300
Trade 4: Loss! (-1% of €10,300 = €103). Capital: €10,197
Trade 5: Win! (+2% of €10,197 = €203.94). Capital: €10,401 …and so on…
The Math Over Time: For every 10 trades, with a 50% win rate:
5 Wins: 5 x (2% of capital) = +10% of capital
5 Losses: 5 x (1% of capital) = -5% of capital
Net Gain: +5% of capital for every 10 trades.
To double €10,000 to €20,000, you need to make approximately 100% net profit. Since you’re making about 5% per cycle of 10 trades, you’d need roughly 20 cycles of 10 trades (200 trades total) to reach your goal, assuming this consistent compounding and win rate.
After ~10 trades (5 wins, 5 losses): Capital is ~€10,500
After ~20 trades: Capital is ~€11,025
…This compounding effect accelerates as your capital grows.
The Story: Slow, steady, and disciplined wins over time. You take your small losses as they come, knowing that your winners are twice as big, allowing your equity curve to gradually climb towards your €20,000 target. It’s a marathon, not a sprint, but the numbers consistently work in your favor.
Example 2: Doubling with a 1:3 Risk-Reward Ratio
Your Plan: For every €1 you risk, you aim to make €3.
Risk per trade: 1% of your capital.
Reward per winning trade: 3% of your capital.
Loss per losing trade: 1% of your capital.
Let’s assume a slightly lower, but still common, 40% win rate (you win 4 out of 10 trades).
Hypothetical Trade Sequence (starting at €10,000):
Trade 1: Win! (+3% of €10,000 = €300). Capital: €10,300
Trade 2: Loss! (-1% of €10,300 = €103). Capital: €10,197
Trade 3: Loss! (-1% of €10,197 = €101.97). Capital: €10,095
Trade 4: Win! (+3% of €10,095 = €302.85). Capital: €10,398 …and so on…
The Math Over Time: For every 10 trades, with a 40% win rate:
4 Wins: 4 x (3% of capital) = +12% of capital
6 Losses: 6 x (1% of capital) = -6% of capital
Net Gain: +6% of capital for every 10 trades.
Even with a lower win rate, your higher risk-reward ratio means you’re still net positive! To double from €10,000 to €20,000 (100% net profit), you’d need roughly 17 cycles of 10 trades (170 trades total).
The Story: This approach is about seeking out those less frequent, but more impactful, home runs. You’re accepting more small losses, but when you win, you win big enough to cover those losses and then some. It requires more patience to wait for those higher reward setups and mental fortitude to endure more consecutive losses, but the compounding effect can be even faster.
Key Takeaways for Doubling Your Capital:
Consistency is King: It’s not about one huge win, but consistently applying your strategy and risk management.
Compounding Power: As your capital grows, the absolute value of your 1% risk and 2% or 3% reward also grows, accelerating your journey.
Discipline with Stop Losses: Crucially, for these risk-reward ratios to mean anything, you must use a stop loss on every trade. If you let a single loss run uncontrolled, it can easily wipe out weeks or months of consistent gains and derail your entire doubling goal. The “risk” in “risk-reward” is only valid if that risk is strictly enforced.
💰Quotes:
“Enter the trade — then sit on your hands like a monk!”
“We don’t click and panic. We click and chill.”
“Traders who wait, get paid. Traders who fidget… donate!”
“We enter the trade, then do absolutely nothing like pros.”
“Let the market work. You’re not its boss.”
💰Normal Tone Slogans:
“Enter with a plan, then let the trade play out.”
“The work is in the setup — the result comes with patience.”
“We don’t babysit trades. We trust our edge.”
“Entry is action. Waiting is discipline.”
“After entry, emotion has no place — only patience.”
Alright, let’s inject some dark humor into the painful saga of trying to double your €10,000 to €20,000 without the glorious bodyguard known as a stop loss. It’s like planning a meticulously choreographed financial ballet, but forgetting to tell gravity your plans.
The Dream: You’ve got your crisp €10,000. Your plan is solid: find those sweet 1:2 or 1:3 risk-reward setups. Every €1 you theoretically risk will net you €2 or €3. Mathematically, you’re a genius! What could possibly go wrong? You’re basically printing money, just slightly slower than the central bank.
The Reality (When You Ditch the Stop Loss):
Welcome to “Financial Freefall: The No-Net Edition!”
Exhibit A: The “It’s Just a Scratch!” Syndrome (Your 1:2 R:R Becomes 1:Who-Knows-What)
You identify a stellar long setup. You decide your “mental stop” is a neat €100 below your entry (because, you know, 1% of €10,000, keeps things tidy). Your target is a glorious €200 profit.
The Flinch: Price drops €100. You chuckle, “Haha, very funny, market! Trying to shake me out, eh? Not today, satan!” You pat your screen reassuringly.
The Grumble: Price drops to €200 down. Your chuckle turns into a cough. “Right, just a deeper retest. This is healthy price action. It’ll bounce from here. My intuition is telling me to hold!”
The Sweat: Price drops to €500 down. Your palms are clammy. Your €10,000 account is now €9,500. “Okay, this is getting a bit rude. But I don’t want to lock in a loss. I know my analysis was good!” You start whispering encouraging words to your computer screen.
The Panic-Induced Paralysis: The market, sensing your fear (it’s notoriously good at that), decides to really lean into the joke. It drops €1,000. You’re now down 10% on one trade! The theoretical 1:2 risk-reward ratio is now 1:-10, and it’s still going. You’re too terrified to close, too hopeful for a miraculous rebound.
The Grand Finale: That single, unmanaged trade, which was supposed to risk a mere €100, finally closes (or you get a margin call) at a brutal €3,000 loss. Your €10,000 is now €7,000.
The Punchline: You didn’t just fail to make €20,000; you’re now facing a 42.8% gain just to get back to €10,000, let alone €20,000. Your 1:2 R:R ratio just got mugged in a dark alley by the “unlimited risk” monster.
Exhibit B: The “Averaging Down to Oblivion” Maneuver (Your 1:3 R:R Becomes 1:The-Abyss)
You spot a beautiful setup for a €100 risk to €300 reward. You enter. Price immediately drops.
The “Brilliant” Idea: “Aha! It’s cheaper now! I’ll just buy more here. My average entry will drop, and when it goes back up, I’ll make even more!” (This is often the gateway drug to financial ruin). You add another position, doubling your exposure.
The Market’s Double-Tap: The price drops further, giggling maniacally. Your first position is now down €200, your second is down €100. You’re effectively risking €300, and your intended €300 reward now seems like a distant mirage.
The Deep Dive: The price continues its descent. Now you have €500 in unrealized losses. Then €1,000. Then €2,000. You’re now a proud owner of a magnificent financial black hole, sucking in your capital. Most of your €10,000 is now tied up in one perpetually losing trade, desperately waiting for a bounce.
The Account Stagnation (and Then Contraction): Your dreams of doubling are replaced by the grim reality of just trying to get back to breakeven. You can’t take new trades because all your capital is held hostage. You’re the captain of a sinking ship, still shouting about your glorious 1:3 risk-reward ratio while bailing water with a teaspoon.
Exhibit C: The Overnight “Surprise Party” (The Black Swan Gauntlet)
You close your trading day confident, your position showing a small profit, heading towards your 1:2 or 1:3 target. “I don’t need a stop loss, I’ll just manage it tomorrow!” you declare to your pet hamster.
The News Bomb: Overnight, an unexpected geopolitical crisis erupts, or a major company you’re short on announces it found a cure for everything (or the one you’re long on declares bankruptcy via interpretive dance).
The “Gap of Doom”: The market opens the next day, not where you closed, but 10% (or 20%, or more!) against your position. Your €10,000 account, if you had a 1-lot position, might instantly be down €1,000 or €2,000 before you can even blink.
Waking Up to a Nightmare: Your glorious 1:2 or 1:3 risk-reward ratio becomes a cruel joke, as your actual loss is now 1:too-many-f***ing-R. All your hard-earned (or intended) gains are wiped out in a single, unmanaged moment of market savagery.
The Moral of the Hilariously Tragic Story:
Without a stop loss, your beautiful risk-reward ratio is like a meticulously drawn treasure map that leads you directly to a pit of quicksand. Your “risk” becomes an arbitrary line in the sand that the market gleefully steps over. You’re not managing risk; you’re just hoping it all works out. And hope, as any seasoned trader will tell you, is a terrible trading strategy when it’s your primary form of risk management.
💰Quotes:
“Enter the trade — then sit on your hands like a monk!”
“We don’t click and panic. We click and chill.”
“Traders who wait, get paid. Traders who fidget… donate!”
“We enter the trade, then do absolutely nothing like pros.”
“Let the market work. You’re not its boss.”
💰Normal Tone Slogans:
“Enter with a plan, then let the trade play out.”
“The work is in the setup — the result comes with patience.”
“We don’t babysit trades. We trust our edge.”
“Entry is action. Waiting is discipline.”
“After entry, emotion has no place — only patience.”
Alright, let’s talk about turning your humble €10,000 into a magnificent €20,000, not with a magic wand, but with the delightfully consistent (and slightly boring, in a good way) power of risk-reward ratios! This is less about high-octane gambling and more about being the financial equivalent of that person who always wins the board game by quietly accumulating points, while everyone else is busy flipping the table.
Your starting capital: €10,000. Your glorious destination: €20,000. Your secret weapon (besides your brilliant mind): Risking just 1% of your capital per trade, and actually, you know, using that stop loss!
The “Slow and Steady Wins the Financial Race” Method (1:2 Risk-Reward)
Imagine your €10,000 is a very enthusiastic, but slightly chaotic, garden. Your goal is to grow €20,000 worth of prize-winning tomatoes.
Your Rules: For every €100 (that 1% risk) you might lose on a little tomato plant, you’re only planting it if you genuinely believe it’ll yield you a juicy €200 profit. It’s like only betting on a racehorse that promises to run twice as fast as its nearest rival.
The Gardening Process:
Trade 1 (Win!): You plant your tomato. It flourishes! Your €10,000 smiles as it turns into €10,200. “Look at me, compounding already!”
Trade 2 (Oops, a Pest!): A small garden pest (market noise) hits your next plant. You cut your losses swiftly (thanks, stop loss!), losing €102. Your capital dips to €10,098. No drama, just a tiny prune. “Phew, close call, little plant. Next!”
Trade 3 (Another Winner!): Back in business! Another €201.96 profit. Capital: €10,300.
…and so the cycle continues.
The Punchline: You’re not winning every trade. Maybe you win half, maybe 60%, maybe even 40% on a rough week. But because your winners are always twice the size of your losers, your account slowly, but surely, starts resembling a happy little money tree. It’s like having a financial vacuum cleaner that sucks up €2 for every €1 it occasionally drops. It’s not flashy, there are no fireworks, but suddenly, you look up and your €10,000 has quietly, politely, doubled to €20,000. You feel like a wizard, but all you really did was stick to the plan.
The “Fewer but Bigger Fish” Strategy (1:3 Risk-Reward)
Now, let’s get a bit more ambitious with our fishing net. For every €100 risk, you’re only going for the really big ones – those that promise €300 in profit. This means you might catch fewer fish (lower win rate), but when you do, they’re absolute monsters.
Your Rules: You’re a discerning angler. You’ll risk €100, but only for a shot at reeling in €300.
The Fishing Trip:
Trade 1 (Win!): You cast your line, and BOOM! A fat €300 profit! Your €10,000 is now €10,300. “Take THAT, market!”
Trade 2 (Lost the Bait!): Darn. Lost €103. Capital: €10,197. “Oh well, just a tiny minnow escaped.”
Trade 3 (Line Snapped!): Another €101.97 gone. Capital: €10,095. “This fishing trip is harder than it looks…”
Trade 4 (Bigger Catch!): Patience pays off! Another €302.85 win! Capital: €10,398.
The Punchline: You might have more losing trades in a row (that 40% win rate feeling like you’re mostly losing), but every time you do win, it’s like finding a €300 bill in an old jacket. Those bigger wins easily gobble up your string of small losses. Suddenly, one day, you check your account, and it’s not just back above €10,000, but it’s soaring past €15,000, then… BAM! €20,000! You’ve doubled your money, perhaps with fewer trades than the 1:2 crowd, proving that sometimes, you just need fewer, higher-quality shots on goal.
In both scenarios, the humor lies in the seemingly mundane, yet incredibly powerful, act of consistently cutting your losses short and letting your winners run, allowing compounding to do its quiet, mathematical magic. No drama, no blowing up accounts, just the satisfying click of profits accumulating while the market tries (and fails) to tempt you into self-sabotage.
💰Quotes:
“Enter the trade — then sit on your hands like a monk!”
“We don’t click and panic. We click and chill.”
“Traders who wait, get paid. Traders who fidget… donate!”
“We enter the trade, then do absolutely nothing like pros.”
“Let the market work. You’re not its boss.”
💰Normal Tone Slogans:
“Enter with a plan, then let the trade play out.”
“The work is in the setup — the result comes with patience.”
“We don’t babysit trades. We trust our edge.”
“Entry is action. Waiting is discipline.”
“After entry, emotion has no place — only patience.”
Price Action Charts

- Is the current trend bullish or bearish?
2. Is the main trend bullish or bearish on selected timeframe?
3. Where is price now? where are the keylevels?
4. Are there any Price Action?
5. Are there any failed Price Action?
6. Is there evidence that the market is getting rid of buyers or sellers?
💰“The Power of Price Action”
Quotes:
“Let Price Tell the Story.”
“Price Never Lies – Everything Else Might.”
“Trade What You See, Not What You Think.”
“Candles Speak Louder Than Indicators.”
- “The Truth is in the Candles.”
Crypto Chart
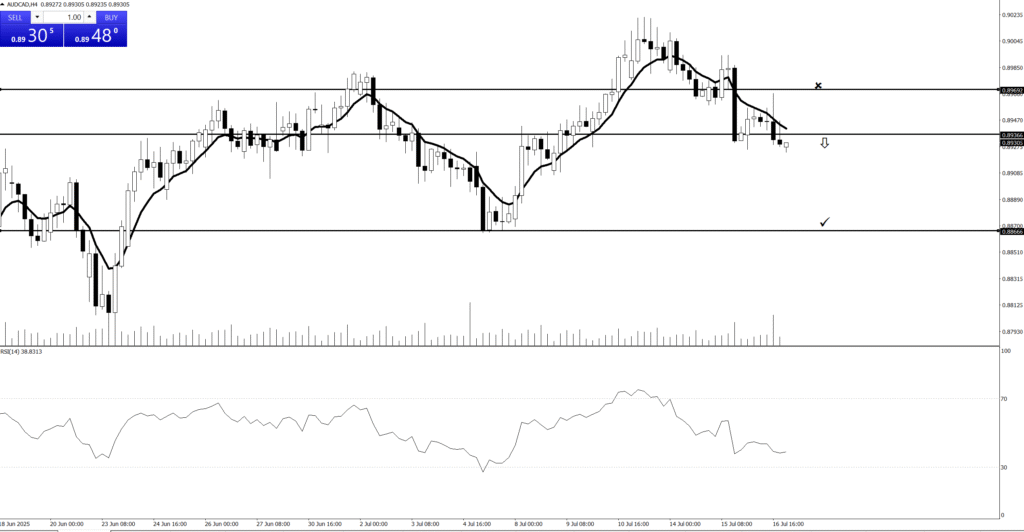
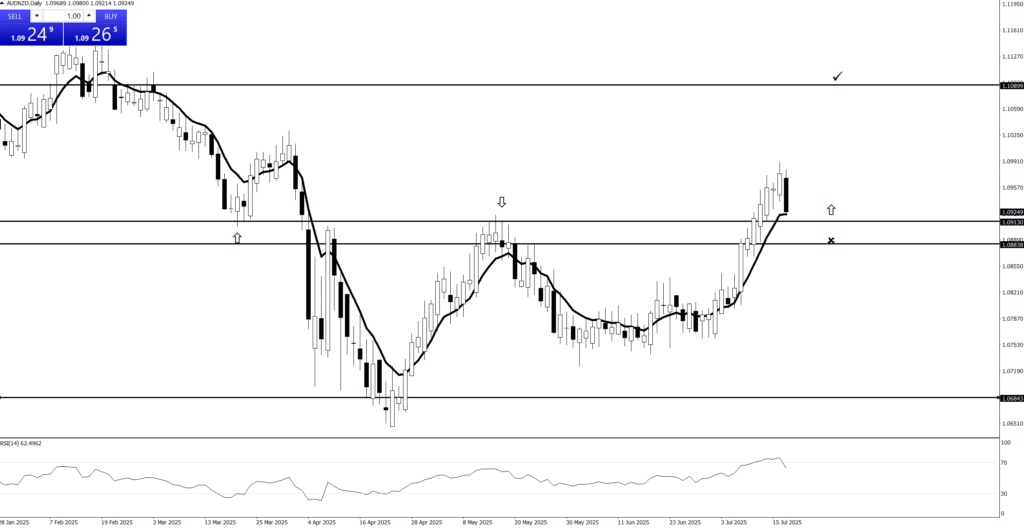
Forex Chart
Stock Chart
Metal Chart
Lorem ipsum dolor sit amet, consectetur adipiscing elit. Ut elit tellus, luctus nec ullamcorper mattis, pulvinar dapibus leo.
Lorem ipsum dolor sit amet, consectetur adipiscing elit. Ut elit tellus, luctus nec ullamcorper mattis, pulvinar dapibus leo.
Lorem ipsum dolor sit amet, consectetur adipiscing elit. Ut elit tellus, luctus nec ullamcorper mattis, pulvinar dapibus leo.
Lorem ipsum dolor sit amet, consectetur adipiscing elit. Ut elit tellus, luctus nec ullamcorper mattis, pulvinar dapibus leo.
Crypto Chart
Lorem ipsum dolor sit amet, consectetur adipiscing elit. Ut elit tellus, luctus nec ullamcorper mattis, pulvinar dapibus leo.
Lorem ipsum dolor sit amet, consectetur adipiscing elit. Ut elit tellus, luctus nec ullamcorper mattis, pulvinar dapibus leo.
Stock Chart
Lorem ipsum dolor sit amet, consectetur adipiscing elit. Ut elit tellus, luctus nec ullamcorper mattis, pulvinar dapibus leo.
Lorem ipsum dolor sit amet, consectetur adipiscing elit. Ut elit tellus, luctus nec ullamcorper mattis, pulvinar dapibus leo.
Forex Chart
Lorem ipsum dolor sit amet, consectetur adipiscing elit. Ut elit tellus, luctus nec ullamcorper mattis, pulvinar dapibus leo.
Lorem ipsum dolor sit amet, consectetur adipiscing elit. Ut elit tellus, luctus nec ullamcorper mattis, pulvinar dapibus leo.
Gold Chart
Lorem ipsum dolor sit amet, consectetur adipiscing elit. Ut elit tellus, luctus nec ullamcorper mattis, pulvinar dapibus leo.
Lorem ipsum dolor sit amet, consectetur adipiscing elit. Ut elit tellus, luctus nec ullamcorper mattis, pulvinar dapibus leo.
Price Action Charts
- Is the current trend bullish or bearish?
2. Is the main trend bullish or bearish on selected timeframe?
3. Where is price now? where are the keylevels?
4. Are there any Price Action?
5. Are there any failed Price Action?
6. Is there evidence that the market is getting rid of buyers or sellers?
💰“The Power of Price Action”
Quotes:
“Let Price Tell the Story.”
“Price Never Lies – Everything Else Might.”
“Trade What You See, Not What You Think.”
“Candles Speak Louder Than Indicators.”
- “The Truth is in the Candles.”
Price action trading charts involve the analysis of raw price movement displayed directly on a chart, typically using candlesticks or bars. This method prioritizes the visual interpretation of how buyers and sellers are interacting, without the immediate reliance on secondary indicators.
By observing patterns in price highs, lows, opens, and closes, traders aim to understand market psychology, identify key support and resistance levels, and discern potential trends or reversals. It’s a direct approach to market analysis, where the price itself is considered the most comprehensive and reliable source of information for making trading decisions.

Trading Charts: Your Market Decoder Ring (and Reality Show!)
Ever stare at a bunch of flickering numbers and think, “There has to be a better way to understand this chaos?” Well, my friend, say hello to Trading Charts!
These aren’t just fancy graphs; they’re the market’s own reality show, condensed into a visual story. Each bar or candlestick is a tiny drama playing out, showing you exactly where the price opened, closed, and briefly went crazy, all over a specific period.
Think of it as your personal decoder ring for the financial world. Instead of trying to guess what’s happening, you’re literally seeing the market’s past behavior laid out before you. Are prices skyrocketing like a cat on a trampoline? Or are they plummeting like a lead balloon? Your chart tells all!
So, grab your popcorn. By learning to read these visual diaries, you’ll start spotting patterns, understanding the market’s moods, and maybe even predicting its next dramatic plot twist. It’s less guesswork, more “aha!” moments.

Price action trading charts emphasize the study of a financial instrument’s price movements over time as the primary source of trading signals. This analytical method focuses on the patterns, structure, and behavior of candlesticks or bars, along with their relationship to key price levels.
The core idea is to understand what the market is communicating directly through its price, without the potential lag or complexity introduced by technical indicators. Traders interpret the battle between buyers and sellers, identify momentum, and anticipate potential shifts by closely observing how price unfolds and reacts within different timeframes, offering a streamlined approach to market analysis.

Trading Charts: Your Crystal Ball (That Only Shows the Past)
Ever wish you had a crystal ball to predict where the market’s going next? Well, you’re in luck! Meet Trading Charts – they’re exactly like a crystal ball, except they only show you what already happened!
But don’t scoff! By carefully examining these squiggly lines and colorful bars, you’re actually reading the market’s historical footprint. Each little flicker, each rise and fall, is a clue. You’re basically a financial detective, piecing together the market’s past crimes (and triumphs) to figure out its likely next move.
So, while they won’t tell you tomorrow’s lottery numbers, charts give you the visual evidence you need to understand the market’s moods, patterns, and probable next steps. They turn the chaotic noise of prices into a readable story. Get ready to put on your detective hat and see what secrets the market’s been keeping!