Lorem ipsum dolor sit amet, consectetur adipiscing elit. Ut elit tellus, luctus nec ullamcorper mattis, pulvinar dapibus leo.
Lorem ipsum dolor sit amet, consectetur adipiscing elit. Ut elit tellus, luctus nec ullamcorper mattis, pulvinar dapibus leo.
Lorem ipsum dolor sit amet, consectetur adipiscing elit. Ut elit tellus, luctus nec ullamcorper mattis, pulvinar dapibus leo.
Lorem ipsum dolor sit amet, consectetur adipiscing elit. Ut elit tellus, luctus nec ullamcorper mattis, pulvinar dapibus leo.
Lorem ipsum dolor sit amet, consectetur adipiscing elit. Ut elit tellus, luctus nec ullamcorper mattis, pulvinar dapibus leo.
Lorem ipsum dolor sit amet, consectetur adipiscing elit. Ut elit tellus, luctus nec ullamcorper mattis, pulvinar dapibus leo.
Lorem ipsum dolor sit amet, consectetur adipiscing elit. Ut elit tellus, luctus nec ullamcorper mattis, pulvinar dapibus leo.
Lorem ipsum dolor sit amet, consectetur adipiscing elit. Ut elit tellus, luctus nec ullamcorper mattis, pulvinar dapibus leo.
CandleSticks
What is a Candlestick?
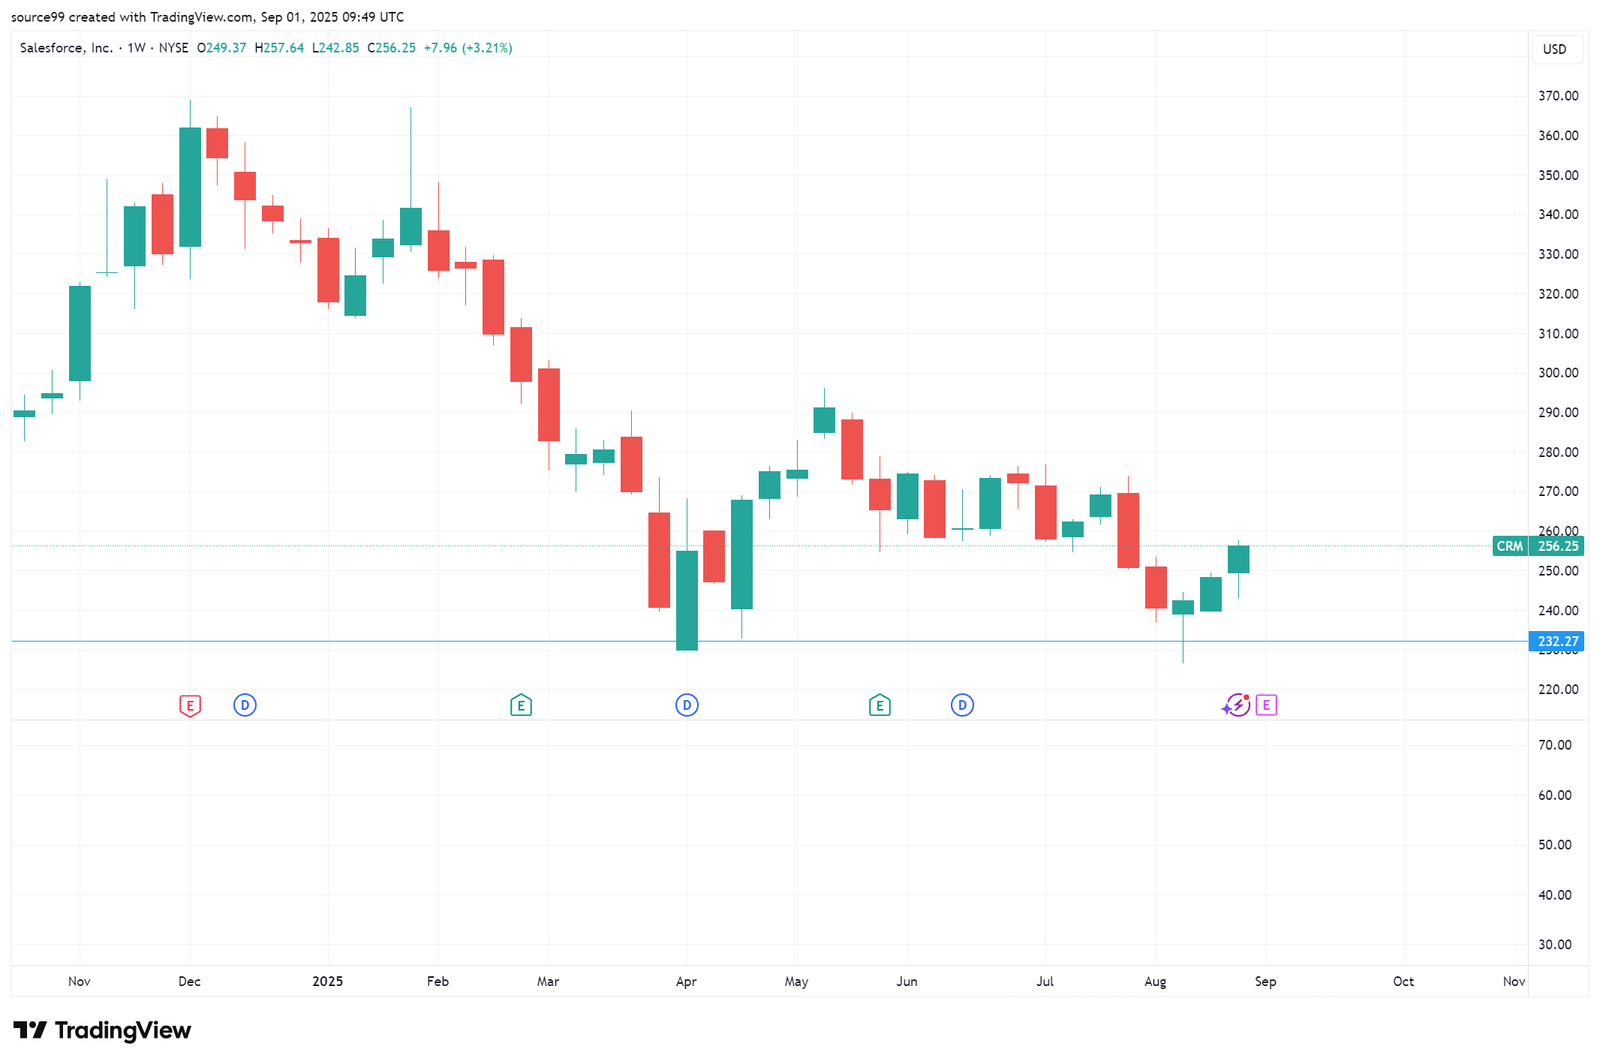
A candlestick is a type of price chart used in technical analysis that displays the high, low, open, and closing prices of a security for a specific period. Originating from Japanese rice traders in the 18th century, candlesticks provide a highly visual and intuitive representation of price action, allowing traders to quickly grasp market sentiment and potential price movements within a given timeframe.
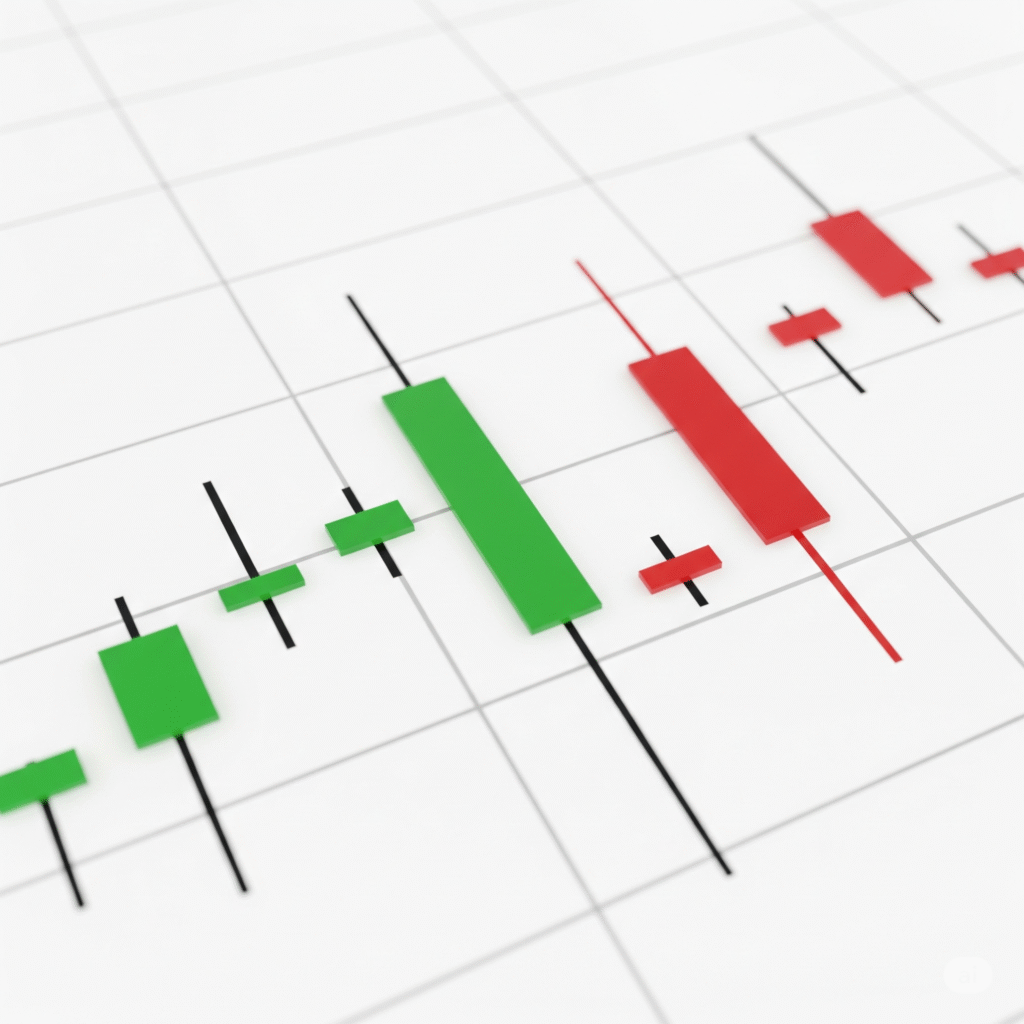
Each candlestick is composed of a “body” and “wicks” (or “shadows”).
The Body: This represents the range between the opening and closing prices.
If the closing price is higher than the opening price, the body is typically colored green or white (indicating a bullish or upward movement).
If the closing price is lower than the opening price, the body is typically colored red or black (indicating a bearish or downward movement).
The Wicks (or Shadows): These are the thin lines extending above and below the body.
The upper wick indicates the highest price reached during the period.
The lower wick indicates the lowest price reached during the period.
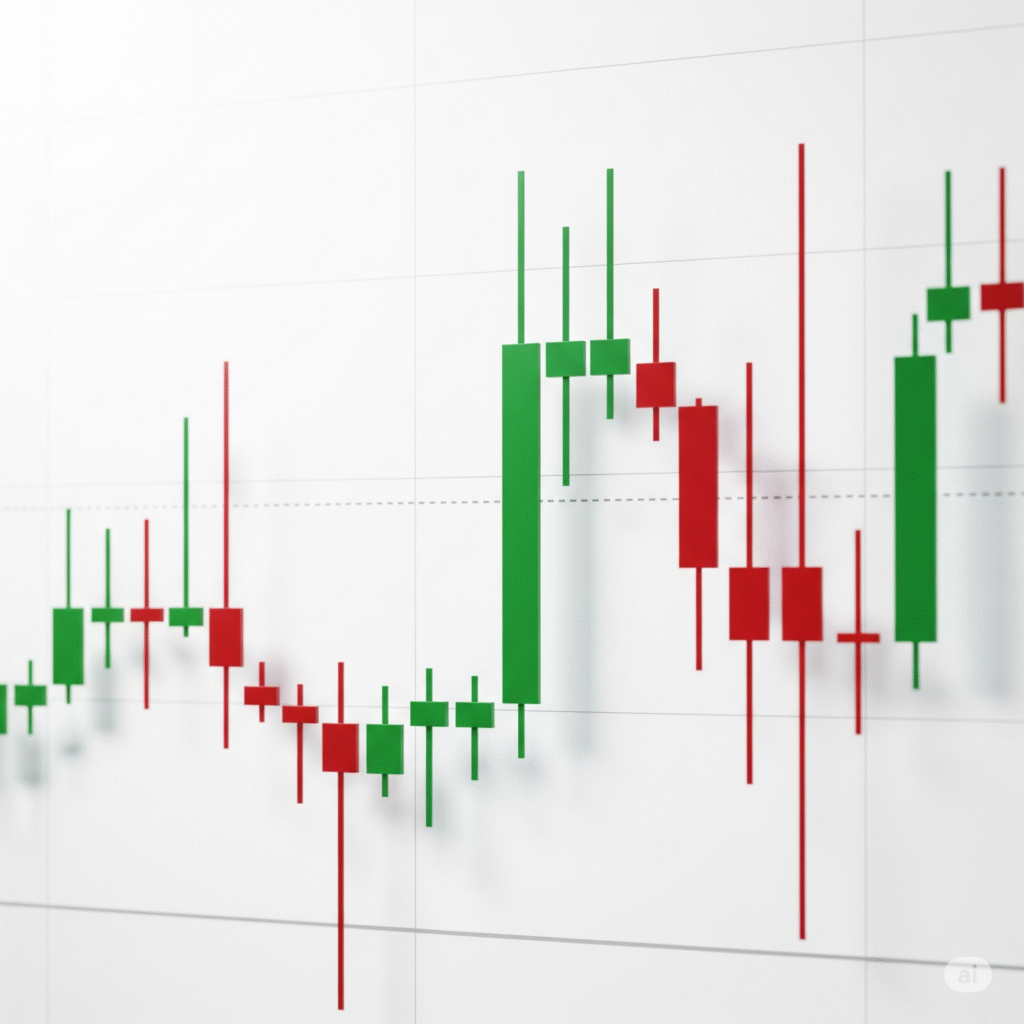
By observing the size, color, and position of the body and wicks, traders can infer the strength of buying or selling pressure, volatility, and potential reversals or continuations of trends.
Now, for the funny bit:
Imagine a candlestick as the market’s tiny, dramatic diary entry for a specific time period. The fat part (the “body”) is where all the real action happened – did it open low and close high (a green party candle, celebrating gains!) or open high and close low (a red panic candle, signaling doom!)?
Then you have the “wicks” or “shadows” – these are like the crazy stories it almost told. The top wick is how high it briefly soared before getting shy, and the bottom wick is how low it dipped before pulling itself together. So, a long top wick means “I tried to go higher, but someone slapped me down!” and a long bottom wick means “I almost fell off a cliff, but then I remembered my self-worth!”
Essentially, each candlestick is a tiny, emotional rollercoaster, telling you a mini-saga of greed, fear, and indecision, all wrapped up in a neat little wax package. And your job, as a trader,
What is a Candlestick?
Professionally speaking:
A candlestick is a type of price chart used in technical analysis that displays the high, low, open, and closing prices of a security for a specific period. Originating from Japanese rice traders in the 18th century, candlesticks provide a highly visual and intuitive representation of price action, allowing traders to quickly grasp market sentiment and potential price movements within a given timeframe.
Each candlestick is composed of a “body” and “wicks” (or “shadows”).
The Body: This represents the range between the opening and closing prices.
If the closing price is higher than the opening price, the body is typically colored green or white (indicating a bullish or upward movement).
If the closing price is lower than the opening price, the body is typically colored red or black (indicating a bearish or downward movement).
The Wicks (or Shadows): These are the thin lines extending above and below the body.
The upper wick indicates the highest price reached during the period.
The lower wick indicates the lowest price reached during the period.
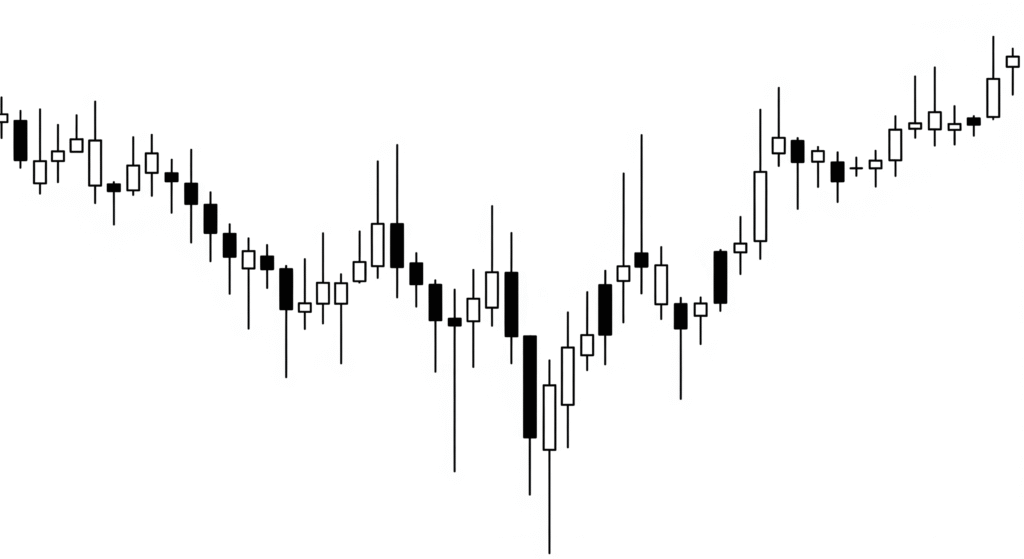
By observing the size, color, and position of the body and wicks, traders can infer the strength of buying or selling pressure, volatility, and potential reversals or continuations of trends.
Now, for the funny bit:
Imagine a candlestick as the market’s tiny, dramatic diary entry for a specific chunk of time. It’s not just “price went up” or “price went down.” Oh no, it’s far more theatrical!
The body is like the main event – where the price started and where it ended up. If it’s a big green (or white) body, it’s basically the market shouting, “Woohoo! Buyers were throwing money around like confetti at a rock concert!” If it’s a chunky red (or black) one, it’s more like, “Panic! Everyone’s running for the exits like they just heard a fire alarm… that was actually just someone microwaving popcorn.”
Then you have the wicks, those skinny little lines poking out. These are the “I almost went there!” moments. The top wick is the price saying, “I briefly touched this high, but then I got cold feet.” The bottom wick is its counterpart, “I dipped this low, but then I remembered my self-worth and bounced back!”
So, when you look at a candlestick, you’re not just seeing numbers; you’re seeing a mini-saga of market indecision, triumph, and regret, all wrapped up in a neat little package. It’s like a tiny, price-action-packed haiku, but instead of poetry, it’s telling you if the bulls or bears won that particular round of the financial wrestling match.