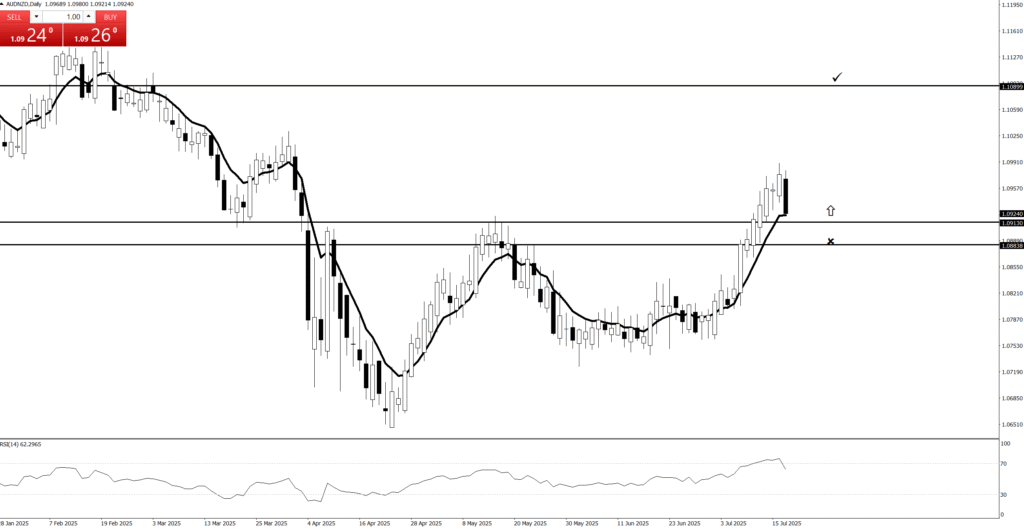
Price Action

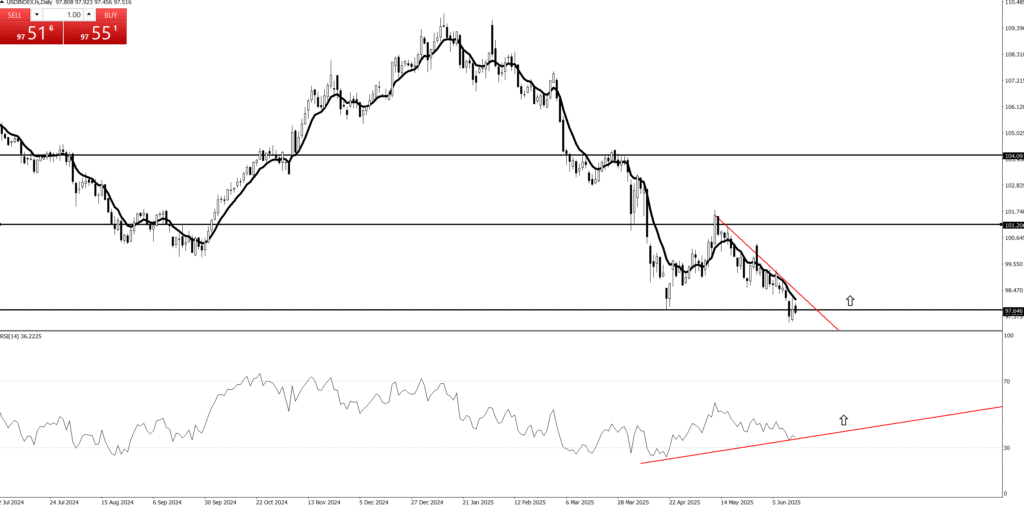
- Is the current trend bullish or bearish?
2. Is the main trend bullish or bearish on selected timeframe?
3. Where is price now? where are the keylevels?
4. Are there any Price Action?
5. Are there any failed Price Action?
6. Is there evidence that the market is getting rid of buyers or sellers?
💰“The Power of Price Action”
Quotes:
“Let Price Tell the Story.”
“Price Never Lies – Everything Else Might.”
“Trade What You See, Not What You Think.”
“Candles Speak Louder Than Indicators.”
- “The Truth is in the Candles.”
“Pinbars”
Okay, here’s a short intro to key levels, keeping it concise and focused on their core meaning in trading:
In the dynamic world of financial trading, key levels are the unsung heroes of technical analysis. Think of them as crucial lines in the sand on a price chart – specific price points where an asset’s value has historically shown significant reaction. Whether acting as support (a floor preventing further falls) or resistance (a ceiling preventing further rises), these levels are where supply and demand typically battle it out. Understanding them is fundamental, as they offer traders powerful insights into potential price reversals, continuations, and strategic points for entering or exiting trades.
“Price Action Charts”
Okay, here’s a short intro to key levels, keeping it concise and focused on their core meaning in trading:
In the dynamic world of financial trading, key levels are the unsung heroes of technical analysis. Think of them as crucial lines in the sand on a price chart – specific price points where an asset’s value has historically shown significant reaction. Whether acting as support (a floor preventing further falls) or resistance (a ceiling preventing further rises), these levels are where supply and demand typically battle it out. Understanding them is fundamental, as they offer traders powerful insights into potential price reversals, continuations, and strategic points for entering or exiting trades.


Lorem ipsum dolor sit amet, consectetur adipiscing elit. Ut elit tellus, luctus nec ullamcorper mattis, pulvinar dapibus leo.
Lorem ipsum dolor sit amet, consectetur adipiscing elit. Ut elit tellus, luctus nec ullamcorper mattis, pulvinar dapibus leo.

Add Your Heading Text Here
Lorem ipsum dolor sit amet, consectetur adipiscing elit. Ut elit tellus, luctus nec ullamcorper mattis, pulvinar dapibus leo.
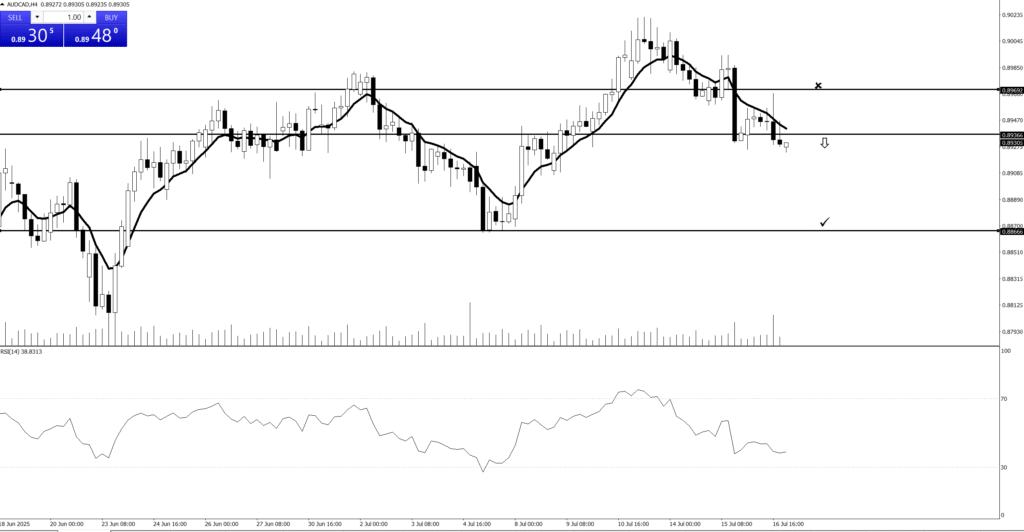
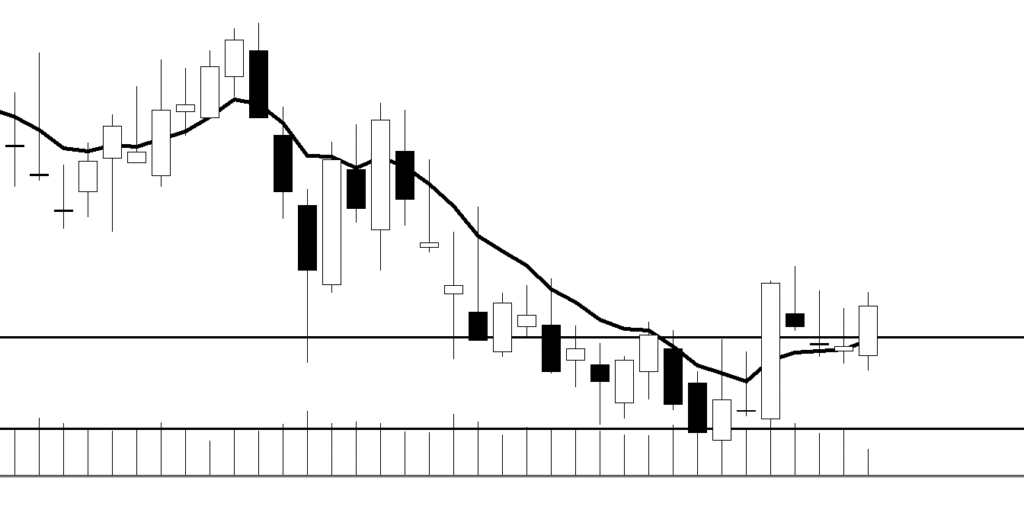


Lorem ipsum dolor sit amet, consectetur adipiscing elit. Ut elit tellus, luctus nec ullamcorper mattis, pulvinar dapibus leo.
Lorem ipsum dolor sit amet, consectetur adipiscing elit. Ut elit tellus, luctus nec ullamcorper mattis, pulvinar dapibus leo.

The Power of the Trend

💰Funny Tone Slogans:
“Enter the trade — then sit on your hands like a monk!”
“We don’t click and panic. We click and chill.”
“Traders who wait, get paid. Traders who fidget… donate!”
“We enter the trade, then do absolutely nothing like pros.”
“Let the market work. You’re not its boss.”
Lorem ipsum dolor sit amet, consectetur adipiscing elit. Ut elit tellus, luctus nec ullamcorper mattis, pulvinar dapibus leo.
Lorem ipsum dolor sit amet, consectetur adipiscing elit. Ut elit tellus, luctus nec ullamcorper mattis, pulvinar dapibus leo.
💰Funny Tone Slogans:
“Enter the trade — then sit on your hands like a monk!”
“We don’t click and panic. We click and chill.”
“Traders who wait, get paid. Traders who fidget… donate!”
“We enter the trade, then do absolutely nothing like pros.”
“Let the market work. You’re not its boss.”
💰Funny Tone Slogans:
“Enter the trade — then sit on your hands like a monk!”
“We don’t click and panic. We click and chill.”
“Traders who wait, get paid. Traders who fidget… donate!”
“We enter the trade, then do absolutely nothing like pros.”
“Let the market work. You’re not its boss.”
Lorem ipsum dolor sit amet, consectetur adipiscing elit. Ut elit tellus, luctus nec ullamcorper mattis, pulvinar dapibus leo.
Lorem ipsum dolor sit amet, consectetur adipiscing elit. Ut elit tellus, luctus nec ullamcorper mattis, pulvinar dapibus leo.
Lorem ipsum dolor sit amet, consectetur adipiscing elit. Ut elit tellus, luctus nec ullamcorper mattis, pulvinar dapibus leo.
Lorem ipsum dolor sit amet, consectetur adipiscing elit. Ut elit tellus, luctus nec ullamcorper mattis, pulvinar dapibus leo.
Lorem ipsum dolor sit amet, consectetur adipiscing elit. Ut elit tellus, luctus nec ullamcorper mattis, pulvinar dapibus leo.
Lorem ipsum dolor sit amet, consectetur adipiscing elit. Ut elit tellus, luctus nec ullamcorper mattis, pulvinar dapibus leo.
Lorem ipsum dolor sit amet, consectetur adipiscing elit. Ut elit tellus, luctus nec ullamcorper mattis, pulvinar dapibus leo.
Lorem ipsum dolor sit amet, consectetur adipiscing elit. Ut elit tellus, luctus nec ullamcorper mattis, pulvinar dapibus leo.
StopLoss

Lorem ipsum dolor sit amet, consectetur adipiscing elit. Ut elit tellus, luctus nec ullamcorper mattis, pulvinar dapibus leo.

Lorem ipsum dolor sit amet, consectetur adipiscing elit. Ut elit tellus, luctus nec ullamcorper mattis, pulvinar dapibus leo.

Lorem ipsum dolor sit amet, consectetur adipiscing elit. Ut elit tellus, luctus nec ullamcorper mattis, pulvinar dapibus leo.

Lorem ipsum dolor sit amet, consectetur adipiscing elit. Ut elit tellus, luctus nec ullamcorper mattis, pulvinar dapibus leo.

Lorem ipsum dolor sit amet, consectetur adipiscing elit. Ut elit tellus, luctus nec ullamcorper mattis, pulvinar dapibus leo.
Lorem ipsum dolor sit amet, consectetur adipiscing elit. Ut elit tellus, luctus nec ullamcorper mattis, pulvinar dapibus leo.

Our Trading Place
Calm And Collected
Lorem ipsum dolor sit amet, consectetur adipiscing elit. Ut elit tellus, luctus nec ullamcorper mattis, pulvinar dapibus leo.


Lorem ipsum dolor sit amet, consectetur adipiscing elit. Ut elit tellus, luctus nec ullamcorper mattis, pulvinar dapibus leo.
Lorem ipsum dolor sit amet, consectetur adipiscing elit. Ut elit tellus, luctus nec ullamcorper mattis, pulvinar dapibus leo.

“Calm trading means consistent charts.”
“Same chart, same story — less confusion, more clarity.”
“Timeframe hopping creates
Lorem ipsum dolor sit amet, consectetur adipiscing elit. Ut elit tellus, luctus nec ullamcorper mattis, pulvinar dapibus leo.


Lorem ipsum dolor sit amet, consectetur adipiscing elit. Ut elit tellus, luctus nec ullamcorper mattis, pulvinar dapibus leo.
Lorem ipsum dolor sit amet, consectetur adipiscing elit. Ut elit tellus, luctus nec ullamcorper mattis, pulvinar dapibus leo.

Our Trading Place
Calm And Collected
Lorem ipsum dolor sit amet, consectetur adipiscing elit. Ut elit tellus, luctus nec ullamcorper mattis, pulvinar dapibus leo.


Lorem ipsum dolor sit amet, consectetur adipiscing elit. Ut elit tellus, luctus nec ullamcorper mattis, pulvinar dapibus leo.
Lorem ipsum dolor sit amet, consectetur adipiscing elit. Ut elit tellus, luctus nec ullamcorper mattis, pulvinar dapibus leo.

“Calm trading means consistent charts.”
“Same chart, same story — less confusion, more clarity.”
“Timeframe hopping creates
Lorem ipsum dolor sit amet, consectetur adipiscing elit. Ut elit tellus, luctus nec ullamcorper mattis, pulvinar dapibus leo.

🔹
1. Filtering Out Market Noise (The Signal is Clearer):
Lower Timeframe Chaos: Intraday charts (minutes, hours) are notoriously volatile and filled with “noise”—random price fluctuations that don’t signify any real shift in market sentiment. These smaller timeframes generate countless false signals, leading to overtrading, increased transaction costs, and emotional fatigue.
Higher Timeframe Clarity: Each candle on a daily, weekly, or monthly chart encapsulates a significant amount of trading activity and volume. This effectively filters out the short-term distractions, revealing the underlying, more reliable trends and patterns. A long wick on a daily chart, for instance, represents a much more significant rejection than a long wick on a 5-minute chart.

🔹
3. Reduced Stress and Emotional Control:
Trading on higher timeframes means fewer trading opportunities, but those opportunities are typically of much higher quality. This eliminates the pressure to constantly monitor charts and make rapid-fire decisions, which is a major source of stress and emotional errors for retail traders.
We have ample time to analyze closed candlesticks, confirm confluence with our 8-period and 23-period EMAs, assess risk/reward, and meticulously plan our entries and exits. This calmer approach significantly improves decision-making and helps maintain psychological composure.

🔹
4. Better Risk/Reward Opportunities:
While trades on higher timeframes may require wider stop losses in terms of pips, they also offer substantially larger take profit targets. This allows for superior risk/reward ratios (e.g., 1:2, 1:3, or higher) which are crucial for long-term profitability, even if the win rate isn’t exceptionally high.
The movements captured on daily, weekly, or monthly charts represent more significant price swings, leading to potentially larger profits per successful trade.

🔹
5. Lower Transaction Costs (Fewer Trades, More Impact):
Trading less frequently inherently means lower cumulative transaction costs (commissions, spreads, slippage). For many retail traders, excessive transaction costs on lower timeframes can significantly erode potential profits, even if their win rate is positive.

🔹
6. Robustness of Signals and Patterns:
Key price action patterns (Pin Bars, Engulfing Bars, False Breaks, Hikkake, Inside Bars) are far more reliable when they form on higher timeframes. The conviction behind these patterns is stronger because they represent the collective action of more traders and more significant volume over a longer period.
By strictly adhering to trading only on daily, weekly, or monthly charts, we adopt a swing trading or positional trading style that prioritizes quality over quantity, aligns with the dominant market forces, and supports the psychological resilience necessary to be among the successful professional traders. This choice is integral to filtering for the “easiest setups” that offer the highest probability of success.

🔧 Tips for Effective Pin Bar Trading
Trade with trend for higher probability.
Use with support/resistance, Fibonacci, or moving averages.
Avoid trading pin bars in choppy or low-volume conditions.
Look for strong rejection candles with good context — not just any long wick.

22. We Take Trades Based on Daily, Weekly or Monthy
imeframe selection. This decision is fundamental to avoiding market noise, aligning with institutional flows, and maintaining the psychological discipline necessary for consistent profitability. We exclusively take trades based on daily, weekly, or monthly charts. This deliberate focus on higher timeframes is not arbitrary; it’s a strategic choice driven by several key advantages that are “obvious for the professionals”:
🕰️ We Only Trade Daily, Weekly, or Monthly Timeframes
🧠 Why?

✅ Cleaner Signals
No noise. No distractions. Just pure structure.

✅ Stronger Levels
Key support/resistance on higher timeframes are respected by institutions.

✅ Better Risk/Reward
Bigger swings = bigger potential profits.

✅ More Time, Less Stress
You don’t need to stare at charts all day.

🔒 Our Rule:
“If it’s not on the daily, weekly, or monthly — we don’t trade it.”

