The Power of EMA

💰
EMA: The Trend’s Trendy, Speed-Addicted Cousin!
If you’re still using the Simple Moving Average (SMA), you’re essentially getting your stock market news from a carrier pigeon. It works, sure, but it’s painfully slow! It’s time to upgrade to the high-speed financial fiber optics: the Exponential Moving Average (EMA).
The EMA is a professional trader’s best friend because it’s the only average that prioritizes the juicy, current drama.1 It gives more weight to the most recent prices, making it lightning-fast and super responsive to new market conditions.2
The Advantages of Speed (and Less Regret!)
Zero-Lag Entry: The biggest enemy of a trend trader is late entry. The EMA fixes this! Because it reacts quicker than the plodding SMA, it gives you a heads-up that a trend is reversing or starting sooner.3 This means you get in at a better price, avoiding that sinking feeling of buying a breakout after it’s already run away.
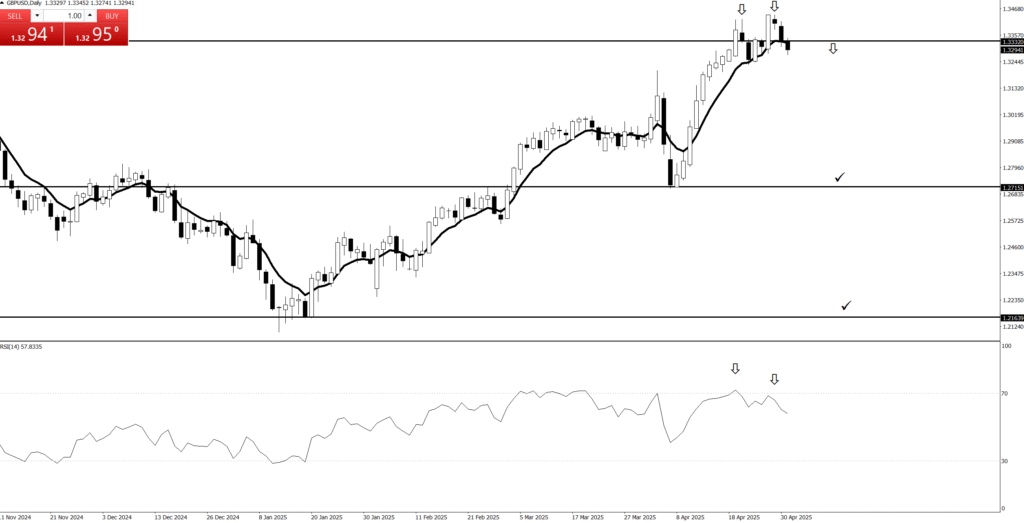
Dynamic Support & Resistance (That Actually Moves!): The EMA doesn’t just passively follow the price; it acts as a magnetic, moving area of support or resistance.4 During a healthy trend, the price often pulls back and perfectly bounces off a key EMA (like the 21 or 50-period).5 These bounces are your low-risk, high-probability pullback entries—the market hitting its mandatory mid-trend coffee break right where you’re waiting.
The Trend Confirmation Stack: Want to feel invincible? Use multiple EMAs (e.g., 9, 21, and 50).6 When these lines stack neatly on top of each other and all point in the same direction, they provide an unshakeable, visual confirmation of the trend’s strength. It’s the market’s way of giving you a massive high-five and assuring you, “Yes, this is the right side!”
Trend-Following GPS: EMAs keep you honest. When the price is consistently trading above a key EMA, you only look to buy. When it’s consistently below, you only look to sell (or short). This instantly filters out half the bad trade ideas and keeps you aligned with the dominant flow.
Stop trading with slow, boring averages! Embrace the speed and responsiveness of the EMA. It’s the professional, exciting way to stay ahead of the crowd and catch those lucrative market shifts before the slow-pokes even know what hit them!
💰Quotes:
“Price action is the only truth on the chart.”
“Everything you need to know is written in the candles.”
“Indicators lag, price action leads.”
“Trade what you see, not what you think.”
“Every candle tells a story. Learn to read it.”

💰Quotes:
“Support and resistance are the footprints of money.”
“A closed candle is a fact, an open candle is only a possibility.”
“The market doesn’t hide; it leaves clues in price action.”
“The best trades look obvious… after you’ve learned to see them.”
“Patterns are just human emotions drawn on a chart.”
The Power of PriceAction
💰What in the Kraken’s Name is Price Action?
Imagine you’re on a bustling market street, and everyone’s shouting their prices for pineapples. You don’t need a fancy economist with a spreadsheet to tell you if pineapples are getting more popular or less. You just watch what people are doing: are they eagerly snatching them up at higher prices, or are the vendors struggling to give them away?
Price action is exactly that, but for stocks and other assets! It’s simply reading the story the market is telling you directly through the price itself. No need for complicated, lagging indicators that are always a step behind, like a tired parrot squawking old news. You’re looking at the raw, unfiltered moves on your chart – the ultimate truth of supply and demand, fear and greed.
💰Why is it the Golden Compass of Trading?
Forget trying to navigate with a half-broken sextant! Price action is your North Star, your most reliable guide:
It’s the OG (Original Gangster) Signal: Every indicator you see on a chart is derived from price. Price action is the price. It’s the source code, the main event, the real deal. When you’re looking at price action, you’re getting the news straight from the horse’s mouth, not through a dozen gossipy villagers.
No Lag, Just Action! Imagine trying to surf a wave by looking at where the last wave broke. You’d be wiped out! Many indicators are “lagging,” meaning they tell you what already happened. Price action is live, in the moment, allowing you to catch the wave as it forms. This means quicker decisions, tighter entries, and less time being swept away by unexpected currents.
Simpler Than a Coconut Cocktail: You don’t need a supercomputer or a massive collection of complex tools. A clean chart, your trusty eyeballs, and a basic understanding of candlestick patterns are often all you need. This simplicity reduces overwhelm and helps you make clear, decisive calls without second-guessing.
The Trend is Your Best Mate! Remember that wise old saying, “the trend is your friend”? Price action is the ultimate wingman for spotting that friend! It’s super easy to see if the market is clearly sailing upwards (making higher highs and higher lows), diving downwards (lower lows and lower highs), or just bobbing around in the doldrums. If the trend is clear, you know exactly which direction to point your ship. If it’s messy, price action tells you to stay ashore and enjoy a pineapple smoothie!
💰How to Read the Market’s Secret Diary (The Candlesticks!)
Each little candle on your chart is like a tiny scroll, telling you a mini-story of what happened during that time period (a minute, an hour, a day).
The Body: This is the fat part of the candle. A long green (or white) body means buyers were in control, pushing the price way up. A long red (or black) body means sellers dominated, sending the price tumbling. Think of it as a tug-of-war: who won that round?
The Wicks (or Shadows): These thin lines sticking out from the top and bottom are like antennae, showing you how far the price tried to go but got rejected. A long upper wick means buyers tried to push it high but sellers dragged it back down. A long lower wick means sellers tried to push it low but buyers bravely picked it up. These wicks often whisper secrets about exhaustion or reversals!
By watching how these candles form patterns – like a “Hammer” hitting rock bottom and bouncing back up (a sign of buyers coming to the rescue!), or an “Engulfing” pattern where one big candle swallows the previous one (a dramatic shift in power!) – you start to predict where the currents might take you next.
So, next time you’re charting your course, clear your deck, breathe in that salty air, and let the price action speak to you. It’s the most direct, most powerful, and frankly, the most fun way to understand what’s truly happening in the market and chart your way to potential success!
💰Quotes:
“Price action is the only truth on the chart.”
“Everything you need to know is written in the candles.”
“Indicators lag, price action leads.”
“Trade what you see, not what you think.”
“Every candle tells a story. Learn to read it.”
💰Quotes:
“Support and resistance are the footprints of money.”
“A closed candle is a fact, an open candle is only a possibility.”
“The market doesn’t hide; it leaves clues in price action.”
“The best trades look obvious… after you’ve learned to see them.”
“Patterns are just human emotions drawn on a chart.”
💰Quotes:
“Price action: the art of staring at candles until they confess.”
“Indicators are like rumors; price action is the witness.”
“Trading without price action is like driving blindfolded.”
“Sometimes the best trade is to just let the candle close.”
“If you can’t find the trend, step back and squint—price action is waving at you.”
💰Quotes:
“Enter the trade — then sit on your hands like a monk!”
“We don’t click and panic. We click and chill.”
“Traders who wait, get paid. Traders who fidget… donate!”
“We enter the trade, then do absolutely nothing like pros.”
“Let the market work. You’re not its boss.”
💰Quotes:
“Enter the trade — then sit on your hands like a monk!”
“We don’t click and panic. We click and chill.”
“Traders who wait, get paid. Traders who fidget… donate!”
“We enter the trade, then do absolutely nothing like pros.”
“Let the market work. You’re not its boss.”
💰Quotes:
“Enter the trade — then sit on your hands like a monk!”
“We don’t click and panic. We click and chill.”
“Traders who wait, get paid. Traders who fidget… donate!”
“We enter the trade, then do absolutely nothing like pros.”
“Let the market work. You’re not its boss.”
The Power of PriceAction
What is Price Action?!
Price action is a trading methodology that analyzes the movement of an asset’s price over time to make trading decisions. It is the foundation of technical analysis and operates on the principle that all relevant market information—including economic news, investor sentiment, and fundamental data—is already reflected in the asset’s price.
Instead of relying on lagging technical indicators, traders who use price action focus on a “naked” or clean chart. By observing historical price data, they identify patterns, trends, and key levels to predict future price direction.The core concepts of price action analysis include:Support and Resistance
These are price levels where an asset’s price has historically paused or reversed direction. A support level is a price floor where buying pressure is strong enough to prevent the price from falling further. A resistance level is a price ceiling where selling pressure is sufficient to stop the price from rising higher.
Candlestick Patterns
Candlestick charts are a primary tool for price action traders. Each candlestick represents a specific period and shows the open, high, low, and closing prices. The shape and color of the candlesticks form patterns (e.g., Doji, Hammer, Engulfing) that provide insights into market sentiment and can signal potential reversals or continuations.
Trend Analysis
Price action traders identify the market’s trend by observing the sequence of highs and lows. An uptrend is characterized by a series of higher highs and higher lows, while a downtrend is marked by lower highs and lower lows. A break in this sequence can indicate a potential trend reversal.
💰Quotes:
“Price action is the only truth on the chart.”
“Everything you need to know is written in the candles.”
“Indicators lag, price action leads.”
“Trade what you see, not what you think.”
“Every candle tells a story. Learn to read it.”
💰Quotes:
“Support and resistance are the footprints of money.”
“A closed candle is a fact, an open candle is only a possibility.”
“The market doesn’t hide; it leaves clues in price action.”
“The best trades look obvious… after you’ve learned to see them.”
“Patterns are just human emotions drawn on a chart.”
The Power of EMA
EMA: Your Market Navigator with a Need for Speed!
If you’re still relying on the clunky Simple Moving Average (SMA), you’re essentially using a rotary phone in the age of fiber optics. It’s time to get a trading tool that moves as fast as the market: the Exponential Moving Average (EMA)!
The EMA isn’t just an average; it’s a dynamic, trend-following machine that prioritizes the most recent price action. It gives more weight to the “now,” which means it tells you what the market is doing right now, not what it was doing last Tuesday.
The Thrill of Timeliness and Precision
-
Catching the Wave Early: The biggest advantage of the EMA is its low lag. When a new trend starts or an old one reverses, the EMA is quicker to turn than its slower counterpart. This responsiveness allows you, the professional, to enter the trade sooner and maximize your profit potential. It’s the difference between catching the train at the station or chasing it down the track!
-
The Bouncing Ball Entry: In a strong trend, the price doesn’t go up forever; it pulls back. The EMA (especially popular settings like the 21 or 50) often acts as a magnetic, moving support or resistance level. When the price dips and perfectly bounces off this line, it’s the market giving you a high-probability “reload” signal. These bounces are fantastic, low-risk entry points right into the heart of the established trend.
-
Visual Trend Clarity: Forget complicated chart readings. The EMA provides instant trend confirmation. When the price consistently stays above a key EMA, you are bullish. When it stays below, you are bearish. It cuts through market confusion and gives you a crystal-clear directional bias—eliminating half your bad trade ideas instantly!
-
Trend Health Checkup: Multiple EMAs can be stacked (like 9, 21, 50). When they are all neatly separated and moving in the same direction, it confirms a healthy, powerful trend. When they start to cross and tangle, it’s a giant warning sign that the trend is tired and it’s time to take your profits and find a new opportunity.
Upgrade your trading to the EMA. It’s the professional, fast, and exciting way to ensure you’re always aligned with current momentum, giving you an essential edge over the slow-moving crowd!
💰Quotes:
“Price action is the only truth on the chart.”
“Everything you need to know is written in the candles.”
“Indicators lag, price action leads.”
“Trade what you see, not what you think.”
“Every candle tells a story. Learn to read it.”
💰Quotes:
“Support and resistance are the footprints of money.”
“A closed candle is a fact, an open candle is only a possibility.”
“The market doesn’t hide; it leaves clues in price action.”
“The best trades look obvious… after you’ve learned to see them.”
“Patterns are just human emotions drawn on a chart.”
The Power of PriceAction
What is Price Action?!
Price action is a trading methodology that analyzes the movement of an asset’s price over time to make trading decisions. It is the foundation of technical analysis and operates on the principle that all relevant market information—including economic news, investor sentiment, and fundamental data—is already reflected in the asset’s price.
Instead of relying on lagging technical indicators, traders who use price action focus on a “naked” or clean chart. By observing historical price data, they identify patterns, trends, and key levels to predict future price direction.The core concepts of price action analysis include:Support and Resistance
These are price levels where an asset’s price has historically paused or reversed direction. A support level is a price floor where buying pressure is strong enough to prevent the price from falling further. A resistance level is a price ceiling where selling pressure is sufficient to stop the price from rising higher.
Candlestick Patterns
Candlestick charts are a primary tool for price action traders. Each candlestick represents a specific period and shows the open, high, low, and closing prices. The shape and color of the candlesticks form patterns (e.g., Doji, Hammer, Engulfing) that provide insights into market sentiment and can signal potential reversals or continuations.
Trend Analysis
Price action traders identify the market’s trend by observing the sequence of highs and lows. An uptrend is characterized by a series of higher highs and higher lows, while a downtrend is marked by lower highs and lower lows. A break in this sequence can indicate a potential trend reversal.
💰Quotes:
“Price action is the only truth on the chart.”
“Everything you need to know is written in the candles.”
“Indicators lag, price action leads.”
“Trade what you see, not what you think.”
“Every candle tells a story. Learn to read it.”
💰Quotes:
“Support and resistance are the footprints of money.”
“A closed candle is a fact, an open candle is only a possibility.”
“The market doesn’t hide; it leaves clues in price action.”
“The best trades look obvious… after you’ve learned to see them.”
“Patterns are just human emotions drawn on a chart.”
The Power of PriceAction
💰What in the Kraken’s Name is Price Action?
Imagine you’re on a bustling market street, and everyone’s shouting their prices for pineapples. You don’t need a fancy economist with a spreadsheet to tell you if pineapples are getting more popular or less. You just watch what people are doing: are they eagerly snatching them up at higher prices, or are the vendors struggling to give them away?
Price action is exactly that, but for stocks and other assets! It’s simply reading the story the market is telling you directly through the price itself. No need for complicated, lagging indicators that are always a step behind, like a tired parrot squawking old news. You’re looking at the raw, unfiltered moves on your chart – the ultimate truth of supply and demand, fear and greed.
💰Why is it the Golden Compass of Trading?
Forget trying to navigate with a half-broken sextant! Price action is your North Star, your most reliable guide:
It’s the OG (Original Gangster) Signal: Every indicator you see on a chart is derived from price. Price action is the price. It’s the source code, the main event, the real deal. When you’re looking at price action, you’re getting the news straight from the horse’s mouth, not through a dozen gossipy villagers.
No Lag, Just Action! Imagine trying to surf a wave by looking at where the last wave broke. You’d be wiped out! Many indicators are “lagging,” meaning they tell you what already happened. Price action is live, in the moment, allowing you to catch the wave as it forms. This means quicker decisions, tighter entries, and less time being swept away by unexpected currents.
Simpler Than a Coconut Cocktail: You don’t need a supercomputer or a massive collection of complex tools. A clean chart, your trusty eyeballs, and a basic understanding of candlestick patterns are often all you need. This simplicity reduces overwhelm and helps you make clear, decisive calls without second-guessing.
The Trend is Your Best Mate! Remember that wise old saying, “the trend is your friend”? Price action is the ultimate wingman for spotting that friend! It’s super easy to see if the market is clearly sailing upwards (making higher highs and higher lows), diving downwards (lower lows and lower highs), or just bobbing around in the doldrums. If the trend is clear, you know exactly which direction to point your ship. If it’s messy, price action tells you to stay ashore and enjoy a pineapple smoothie!
💰How to Read the Market’s Secret Diary (The Candlesticks!)
Each little candle on your chart is like a tiny scroll, telling you a mini-story of what happened during that time period (a minute, an hour, a day).
The Body: This is the fat part of the candle. A long green (or white) body means buyers were in control, pushing the price way up. A long red (or black) body means sellers dominated, sending the price tumbling. Think of it as a tug-of-war: who won that round?
The Wicks (or Shadows): These thin lines sticking out from the top and bottom are like antennae, showing you how far the price tried to go but got rejected. A long upper wick means buyers tried to push it high but sellers dragged it back down. A long lower wick means sellers tried to push it low but buyers bravely picked it up. These wicks often whisper secrets about exhaustion or reversals!
By watching how these candles form patterns – like a “Hammer” hitting rock bottom and bouncing back up (a sign of buyers coming to the rescue!), or an “Engulfing” pattern where one big candle swallows the previous one (a dramatic shift in power!) – you start to predict where the currents might take you next.
So, next time you’re charting your course, clear your deck, breathe in that salty air, and let the price action speak to you. It’s the most direct, most powerful, and frankly, the most fun way to understand what’s truly happening in the market and chart your way to potential success!
💰Quotes:
“Price action is the only truth on the chart.”
“Everything you need to know is written in the candles.”
“Indicators lag, price action leads.”
“Trade what you see, not what you think.”
“Every candle tells a story. Learn to read it.”
💰Quotes:
“Support and resistance are the footprints of money.”
“A closed candle is a fact, an open candle is only a possibility.”
“The market doesn’t hide; it leaves clues in price action.”
“The best trades look obvious… after you’ve learned to see them.”
“Patterns are just human emotions drawn on a chart.”
💰Quotes:
“Price action: the art of staring at candles until they confess.”
“Indicators are like rumors; price action is the witness.”
“Trading without price action is like driving blindfolded.”
“Sometimes the best trade is to just let the candle close.”
“If you can’t find the trend, step back and squint—price action is waving at you.”
💰Quotes:
“Enter the trade — then sit on your hands like a monk!”
“We don’t click and panic. We click and chill.”
“Traders who wait, get paid. Traders who fidget… donate!”
“We enter the trade, then do absolutely nothing like pros.”
“Let the market work. You’re not its boss.”
💰Quotes:
“Enter the trade — then sit on your hands like a monk!”
“We don’t click and panic. We click and chill.”
“Traders who wait, get paid. Traders who fidget… donate!”
“We enter the trade, then do absolutely nothing like pros.”
“Let the market work. You’re not its boss.”
💰Quotes:
“Enter the trade — then sit on your hands like a monk!”
“We don’t click and panic. We click and chill.”
“Traders who wait, get paid. Traders who fidget… donate!”
“We enter the trade, then do absolutely nothing like pros.”
“Let the market work. You’re not its boss.”
Add Your Heading Text Here
The Power of PriceAction
What is Price Action?!
Price action is a trading methodology that analyzes the movement of an asset’s price over time to make trading decisions. It is the foundation of technical analysis and operates on the principle that all relevant market information—including economic news, investor sentiment, and fundamental data—is already reflected in the asset’s price.
Instead of relying on lagging technical indicators, traders who use price action focus on a “naked” or clean chart. By observing historical price data, they identify patterns, trends, and key levels to predict future price direction.The core concepts of price action analysis include:Support and Resistance
These are price levels where an asset’s price has historically paused or reversed direction. A support level is a price floor where buying pressure is strong enough to prevent the price from falling further. A resistance level is a price ceiling where selling pressure is sufficient to stop the price from rising higher.
Candlestick Patterns
Candlestick charts are a primary tool for price action traders. Each candlestick represents a specific period and shows the open, high, low, and closing prices. The shape and color of the candlesticks form patterns (e.g., Doji, Hammer, Engulfing) that provide insights into market sentiment and can signal potential reversals or continuations.
Trend Analysis
Price action traders identify the market’s trend by observing the sequence of highs and lows. An uptrend is characterized by a series of higher highs and higher lows, while a downtrend is marked by lower highs and lower lows. A break in this sequence can indicate a potential trend reversal.
💰Quotes:
“Price action is the only truth on the chart.”
“Everything you need to know is written in the candles.”
“Indicators lag, price action leads.”
“Trade what you see, not what you think.”
“Every candle tells a story. Learn to read it.”
💰Quotes:
“Support and resistance are the footprints of money.”
“A closed candle is a fact, an open candle is only a possibility.”
“The market doesn’t hide; it leaves clues in price action.”
“The best trades look obvious… after you’ve learned to see them.”
“Patterns are just human emotions drawn on a chart.”
The Power of EMA
EMA: The Trend’s Trendy, Speed-Addicted Cousin!
If you’re still using the Simple Moving Average (SMA), you’re essentially getting your stock market news from a carrier pigeon. It works, sure, but it’s painfully slow! It’s time to upgrade to the high-speed financial fiber optics: the Exponential Moving Average (EMA).
The EMA is a professional trader’s best friend because it’s the only average that prioritizes the juicy, current drama.1 It gives more weight to the most recent prices, making it lightning-fast and super responsive to new market conditions.2
The Advantages of Speed (and Less Regret!)
Zero-Lag Entry: The biggest enemy of a trend trader is late entry. The EMA fixes this! Because it reacts quicker than the plodding SMA, it gives you a heads-up that a trend is reversing or starting sooner.3 This means you get in at a better price, avoiding that sinking feeling of buying a breakout after it’s already run away.
Dynamic Support & Resistance (That Actually Moves!): The EMA doesn’t just passively follow the price; it acts as a magnetic, moving area of support or resistance.4 During a healthy trend, the price often pulls back and perfectly bounces off a key EMA (like the 21 or 50-period).5 These bounces are your low-risk, high-probability pullback entries—the market hitting its mandatory mid-trend coffee break right where you’re waiting.
The Trend Confirmation Stack: Want to feel invincible? Use multiple EMAs (e.g., 9, 21, and 50).6 When these lines stack neatly on top of each other and all point in the same direction, they provide an unshakeable, visual confirmation of the trend’s strength. It’s the market’s way of giving you a massive high-five and assuring you, “Yes, this is the right side!”
Trend-Following GPS: EMAs keep you honest. When the price is consistently trading above a key EMA, you only look to buy. When it’s consistently below, you only look to sell (or short). This instantly filters out half the bad trade ideas and keeps you aligned with the dominant flow.
Stop trading with slow, boring averages! Embrace the speed and responsiveness of the EMA. It’s the professional, exciting way to stay ahead of the crowd and catch those lucrative market shifts before the slow-pokes even know what hit them!
💰Quotes:
“Price action is the only truth on the chart.”
“Everything you need to know is written in the candles.”
“Indicators lag, price action leads.”
“Trade what you see, not what you think.”
“Every candle tells a story. Learn to read it.”
💰Quotes:
“Support and resistance are the footprints of money.”
“A closed candle is a fact, an open candle is only a possibility.”
“The market doesn’t hide; it leaves clues in price action.”
“The best trades look obvious… after you’ve learned to see them.”
“Patterns are just human emotions drawn on a chart.”
The Power of PriceAction
What is Price Action?!
Price action is a trading methodology that analyzes the movement of an asset’s price over time to make trading decisions. It is the foundation of technical analysis and operates on the principle that all relevant market information—including economic news, investor sentiment, and fundamental data—is already reflected in the asset’s price.
Instead of relying on lagging technical indicators, traders who use price action focus on a “naked” or clean chart. By observing historical price data, they identify patterns, trends, and key levels to predict future price direction.The core concepts of price action analysis include:Support and Resistance
These are price levels where an asset’s price has historically paused or reversed direction. A support level is a price floor where buying pressure is strong enough to prevent the price from falling further. A resistance level is a price ceiling where selling pressure is sufficient to stop the price from rising higher.
Candlestick Patterns
Candlestick charts are a primary tool for price action traders. Each candlestick represents a specific period and shows the open, high, low, and closing prices. The shape and color of the candlesticks form patterns (e.g., Doji, Hammer, Engulfing) that provide insights into market sentiment and can signal potential reversals or continuations.
Trend Analysis
Price action traders identify the market’s trend by observing the sequence of highs and lows. An uptrend is characterized by a series of higher highs and higher lows, while a downtrend is marked by lower highs and lower lows. A break in this sequence can indicate a potential trend reversal.
💰Quotes:
“Price action is the only truth on the chart.”
“Everything you need to know is written in the candles.”
“Indicators lag, price action leads.”
“Trade what you see, not what you think.”
“Every candle tells a story. Learn to read it.”
💰Quotes:
“Support and resistance are the footprints of money.”
“A closed candle is a fact, an open candle is only a possibility.”
“The market doesn’t hide; it leaves clues in price action.”
“The best trades look obvious… after you’ve learned to see them.”
“Patterns are just human emotions drawn on a chart.”
The Power of PriceAction
💰What in the Kraken’s Name is Price Action?
Imagine you’re on a bustling market street, and everyone’s shouting their prices for pineapples. You don’t need a fancy economist with a spreadsheet to tell you if pineapples are getting more popular or less. You just watch what people are doing: are they eagerly snatching them up at higher prices, or are the vendors struggling to give them away?
Price action is exactly that, but for stocks and other assets! It’s simply reading the story the market is telling you directly through the price itself. No need for complicated, lagging indicators that are always a step behind, like a tired parrot squawking old news. You’re looking at the raw, unfiltered moves on your chart – the ultimate truth of supply and demand, fear and greed.
💰Why is it the Golden Compass of Trading?
Forget trying to navigate with a half-broken sextant! Price action is your North Star, your most reliable guide:
It’s the OG (Original Gangster) Signal: Every indicator you see on a chart is derived from price. Price action is the price. It’s the source code, the main event, the real deal. When you’re looking at price action, you’re getting the news straight from the horse’s mouth, not through a dozen gossipy villagers.
No Lag, Just Action! Imagine trying to surf a wave by looking at where the last wave broke. You’d be wiped out! Many indicators are “lagging,” meaning they tell you what already happened. Price action is live, in the moment, allowing you to catch the wave as it forms. This means quicker decisions, tighter entries, and less time being swept away by unexpected currents.
Simpler Than a Coconut Cocktail: You don’t need a supercomputer or a massive collection of complex tools. A clean chart, your trusty eyeballs, and a basic understanding of candlestick patterns are often all you need. This simplicity reduces overwhelm and helps you make clear, decisive calls without second-guessing.
The Trend is Your Best Mate! Remember that wise old saying, “the trend is your friend”? Price action is the ultimate wingman for spotting that friend! It’s super easy to see if the market is clearly sailing upwards (making higher highs and higher lows), diving downwards (lower lows and lower highs), or just bobbing around in the doldrums. If the trend is clear, you know exactly which direction to point your ship. If it’s messy, price action tells you to stay ashore and enjoy a pineapple smoothie!
💰How to Read the Market’s Secret Diary (The Candlesticks!)
Each little candle on your chart is like a tiny scroll, telling you a mini-story of what happened during that time period (a minute, an hour, a day).
The Body: This is the fat part of the candle. A long green (or white) body means buyers were in control, pushing the price way up. A long red (or black) body means sellers dominated, sending the price tumbling. Think of it as a tug-of-war: who won that round?
The Wicks (or Shadows): These thin lines sticking out from the top and bottom are like antennae, showing you how far the price tried to go but got rejected. A long upper wick means buyers tried to push it high but sellers dragged it back down. A long lower wick means sellers tried to push it low but buyers bravely picked it up. These wicks often whisper secrets about exhaustion or reversals!
By watching how these candles form patterns – like a “Hammer” hitting rock bottom and bouncing back up (a sign of buyers coming to the rescue!), or an “Engulfing” pattern where one big candle swallows the previous one (a dramatic shift in power!) – you start to predict where the currents might take you next.
So, next time you’re charting your course, clear your deck, breathe in that salty air, and let the price action speak to you. It’s the most direct, most powerful, and frankly, the most fun way to understand what’s truly happening in the market and chart your way to potential success!
💰Quotes:
“Price action is the only truth on the chart.”
“Everything you need to know is written in the candles.”
“Indicators lag, price action leads.”
“Trade what you see, not what you think.”
“Every candle tells a story. Learn to read it.”
💰Quotes:
“Support and resistance are the footprints of money.”
“A closed candle is a fact, an open candle is only a possibility.”
“The market doesn’t hide; it leaves clues in price action.”
“The best trades look obvious… after you’ve learned to see them.”
“Patterns are just human emotions drawn on a chart.”
💰Quotes:
“Price action: the art of staring at candles until they confess.”
“Indicators are like rumors; price action is the witness.”
“Trading without price action is like driving blindfolded.”
“Sometimes the best trade is to just let the candle close.”
“If you can’t find the trend, step back and squint—price action is waving at you.”
💰Quotes:
“Enter the trade — then sit on your hands like a monk!”
“We don’t click and panic. We click and chill.”
“Traders who wait, get paid. Traders who fidget… donate!”
“We enter the trade, then do absolutely nothing like pros.”
“Let the market work. You’re not its boss.”
💰Quotes:
“Enter the trade — then sit on your hands like a monk!”
“We don’t click and panic. We click and chill.”
“Traders who wait, get paid. Traders who fidget… donate!”
“We enter the trade, then do absolutely nothing like pros.”
“Let the market work. You’re not its boss.”
💰Quotes:
“Enter the trade — then sit on your hands like a monk!”
“We don’t click and panic. We click and chill.”
“Traders who wait, get paid. Traders who fidget… donate!”
“We enter the trade, then do absolutely nothing like pros.”
“Let the market work. You’re not its boss.”
Add Your Heading Text Here
The Power of PriceAction
What is Price Action?!
Price action is a trading methodology that analyzes the movement of an asset’s price over time to make trading decisions. It is the foundation of technical analysis and operates on the principle that all relevant market information—including economic news, investor sentiment, and fundamental data—is already reflected in the asset’s price.
Instead of relying on lagging technical indicators, traders who use price action focus on a “naked” or clean chart. By observing historical price data, they identify patterns, trends, and key levels to predict future price direction.The core concepts of price action analysis include:Support and Resistance
These are price levels where an asset’s price has historically paused or reversed direction. A support level is a price floor where buying pressure is strong enough to prevent the price from falling further. A resistance level is a price ceiling where selling pressure is sufficient to stop the price from rising higher.
Candlestick Patterns
Candlestick charts are a primary tool for price action traders. Each candlestick represents a specific period and shows the open, high, low, and closing prices. The shape and color of the candlesticks form patterns (e.g., Doji, Hammer, Engulfing) that provide insights into market sentiment and can signal potential reversals or continuations.
Trend Analysis
Price action traders identify the market’s trend by observing the sequence of highs and lows. An uptrend is characterized by a series of higher highs and higher lows, while a downtrend is marked by lower highs and lower lows. A break in this sequence can indicate a potential trend reversal.
💰Quotes:
“Price action is the only truth on the chart.”
“Everything you need to know is written in the candles.”
“Indicators lag, price action leads.”
“Trade what you see, not what you think.”
“Every candle tells a story. Learn to read it.”
💰Quotes:
“Support and resistance are the footprints of money.”
“A closed candle is a fact, an open candle is only a possibility.”
“The market doesn’t hide; it leaves clues in price action.”
“The best trades look obvious… after you’ve learned to see them.”
“Patterns are just human emotions drawn on a chart.”
The Power of PriceAction

What is Price Action?!
Price action is a trading methodology that analyzes the movement of an asset’s price over time to make trading decisions. It is the foundation of technical analysis and operates on the principle that all relevant market information—including economic news, investor sentiment, and fundamental data—is already reflected in the asset’s price.
Instead of relying on lagging technical indicators, traders who use price action focus on a “naked” or clean chart. By observing historical price data, they identify patterns, trends, and key levels to predict future price direction.The core concepts of price action analysis include:Support and Resistance
These are price levels where an asset’s price has historically paused or reversed direction. A support level is a price floor where buying pressure is strong enough to prevent the price from falling further. A resistance level is a price ceiling where selling pressure is sufficient to stop the price from rising higher.
Candlestick Patterns
Candlestick charts are a primary tool for price action traders. Each candlestick represents a specific period and shows the open, high, low, and closing prices. The shape and color of the candlesticks form patterns (e.g., Doji, Hammer, Engulfing) that provide insights into market sentiment and can signal potential reversals or continuations.
Trend Analysis
Price action traders identify the market’s trend by observing the sequence of highs and lows. An uptrend is characterized by a series of higher highs and higher lows, while a downtrend is marked by lower highs and lower lows. A break in this sequence can indicate a potential trend reversal.
4. Stop Loss
Let’s talk about the unsung hero of our trading strategy, the silent guardian, the watchful protector: the stop-loss.
Our Love-Hate Relationship with the Stop-Loss
Here at [Your Company/Team Name, or “our trading desk”], we’ve got a profound, albeit slightly complicated, relationship with the stop-loss. Think of it like that super-responsible friend who always makes sure you don’t do anything too stupid on a wild night out. You might grumble when they pull you away from that questionable decision, but you’re eternally grateful the next morning when you’re not missing an eyebrow.
That’s our stop-loss. It’s the designated driver for our trades, preventing us from driving our accounts straight into a ditch at 100 miles an hour while screaming, “It’s just a temporary dip! It’ll come back!” (Spoiler alert: it usually doesn’t, not without taking your entire portfolio with it.)
Why We Embrace the “Slightly Painful Nudge”
Some traders, bless their optimistic hearts, view a stop-loss as a personal insult, a sign of weakness, or perhaps a tiny financial guillotine. They’d rather ride a losing trade down to zero, hoping for a miraculous turnaround, like waiting for a flat tire to reinflate itself through sheer willpower.
Not us. We’ve learned that a small, controlled loss is like a tiny paper cut compared to the gaping financial wound of a blown-up account. When our stop-loss gets hit, it’s not a defeat; it’s the market gently (or sometimes firmly) nudging us with a sticky note that says, “Hey, genius, your idea was wrong. Time to exit and rethink your life choices… or at least your next trade.”
The Unspoken Benefits of Our Stop-Loss Obsession
Sleep: Believe it or not, knowing your downside is capped lets you actually close your eyes at night without visions of red numbers dancing in your head. It’s truly revolutionary.
Sanity: Less emotional attachment to a dying trade means fewer arguments with your spouse about why you’re glued to the screen muttering about “support levels.”
Capital Preservation: This is fancy talk for “not losing all your money.” Our stop-loss is like a tiny, vigilant bodyguard for our trading capital, always ready to step in and say, “Alright, that’s enough fun for today.”
The Freedom to Be Wrong (Often!): Since we accept small losses, we’re not afraid to try new things. We know that if a trade goes sideways, our trusty stop-loss will catch us before we fall into the abyss of regret.
So, yes, we use stop-losses. Not because we’re pessimists, but because we’re realists who prefer controlled exits over catastrophic explosions. And honestly, it leaves us with more money for coffee and other vital trading supplies
💰Quotes:
“Enter the trade — then sit on your hands like a monk!”
“We don’t click and panic. We click and chill.”
“Traders who wait, get paid. Traders who fidget… donate!”
“We enter the trade, then do absolutely nothing like pros.”
“Let the market work. You’re not its boss.”
💰Normal Tone Slogans:
“Enter with a plan, then let the trade play out.”
“The work is in the setup — the result comes with patience.”
“We don’t babysit trades. We trust our edge.”
“Entry is action. Waiting is discipline.”
“After entry, emotion has no place — only patience.”
Price Action: From Chaos to Clarity
💰What in the Kraken’s Name is Price Action?
Imagine you’re on a bustling market street, and everyone’s shouting their prices for pineapples. You don’t need a fancy economist with a spreadsheet to tell you if pineapples are getting more popular or less. You just watch what people are doing: are they eagerly snatching them up at higher prices, or are the vendors struggling to give them away?
Price action is exactly that, but for stocks and other assets! It’s simply reading the story the market is telling you directly through the price itself. No need for complicated, lagging indicators that are always a step behind, like a tired parrot squawking old news. You’re looking at the raw, unfiltered moves on your chart – the ultimate truth of supply and demand, fear and greed.
💰Why is it the Golden Compass of Trading?
Forget trying to navigate with a half-broken sextant! Price action is your North Star, your most reliable guide:
It’s the OG (Original Gangster) Signal: Every indicator you see on a chart is derived from price. Price action is the price. It’s the source code, the main event, the real deal. When you’re looking at price action, you’re getting the news straight from the horse’s mouth, not through a dozen gossipy villagers.
No Lag, Just Action! Imagine trying to surf a wave by looking at where the last wave broke. You’d be wiped out! Many indicators are “lagging,” meaning they tell you what already happened. Price action is live, in the moment, allowing you to catch the wave as it forms. This means quicker decisions, tighter entries, and less time being swept away by unexpected currents.
Simpler Than a Coconut Cocktail: You don’t need a supercomputer or a massive collection of complex tools. A clean chart, your trusty eyeballs, and a basic understanding of candlestick patterns are often all you need. This simplicity reduces overwhelm and helps you make clear, decisive calls without second-guessing.
The Trend is Your Best Mate! Remember that wise old saying, “the trend is your friend”? Price action is the ultimate wingman for spotting that friend! It’s super easy to see if the market is clearly sailing upwards (making higher highs and higher lows), diving downwards (lower lows and lower highs), or just bobbing around in the doldrums. If the trend is clear, you know exactly which direction to point your ship. If it’s messy, price action tells you to stay ashore and enjoy a pineapple smoothie!
💰How to Read the Market’s Secret Diary (The Candlesticks!)
Each little candle on your chart is like a tiny scroll, telling you a mini-story of what happened during that time period (a minute, an hour, a day).
The Body: This is the fat part of the candle. A long green (or white) body means buyers were in control, pushing the price way up. A long red (or black) body means sellers dominated, sending the price tumbling. Think of it as a tug-of-war: who won that round?
The Wicks (or Shadows): These thin lines sticking out from the top and bottom are like antennae, showing you how far the price tried to go but got rejected. A long upper wick means buyers tried to push it high but sellers dragged it back down. A long lower wick means sellers tried to push it low but buyers bravely picked it up. These wicks often whisper secrets about exhaustion or reversals!
By watching how these candles form patterns – like a “Hammer” hitting rock bottom and bouncing back up (a sign of buyers coming to the rescue!), or an “Engulfing” pattern where one big candle swallows the previous one (a dramatic shift in power!) – you start to predict where the currents might take you next.
So, next time you’re charting your course, clear your deck, breathe in that salty air, and let the price action speak to you. It’s the most direct, most powerful, and frankly, the most fun way to understand what’s truly happening in the market and chart your way to potential success!
💰Quotes:
“Enter the trade — then sit on your hands like a monk!”
“We don’t click and panic. We click and chill.”
“Traders who wait, get paid. Traders who fidget… donate!”
“We enter the trade, then do absolutely nothing like pros.”
“Let the market work. You’re not its boss.”
💰Normal Tone Slogans:
“Enter with a plan, then let the trade play out.”
“The work is in the setup — the result comes with patience.”
“We don’t babysit trades. We trust our edge.”
“Entry is action. Waiting is discipline.”
“After entry, emotion has no place — only patience.”
The Power of StopLoss

What is Price Action?!
Price action is a trading methodology that analyzes the movement of an asset’s price over time to make trading decisions. It is the foundation of technical analysis and operates on the principle that all relevant market information—including economic news, investor sentiment, and fundamental data—is already reflected in the asset’s price.
Instead of relying on lagging technical indicators, traders who use price action focus on a “naked” or clean chart. By observing historical price data, they identify patterns, trends, and key levels to predict future price direction.The core concepts of price action analysis include:Support and Resistance
These are price levels where an asset’s price has historically paused or reversed direction. A support level is a price floor where buying pressure is strong enough to prevent the price from falling further. A resistance level is a price ceiling where selling pressure is sufficient to stop the price from rising higher.
Candlestick Patterns
Candlestick charts are a primary tool for price action traders. Each candlestick represents a specific period and shows the open, high, low, and closing prices. The shape and color of the candlesticks form patterns (e.g., Doji, Hammer, Engulfing) that provide insights into market sentiment and can signal potential reversals or continuations.
Trend Analysis
Price action traders identify the market’s trend by observing the sequence of highs and lows. An uptrend is characterized by a series of higher highs and higher lows, while a downtrend is marked by lower highs and lower lows. A break in this sequence can indicate a potential trend reversal.
💰Quotes:
“Price action is the only truth on the chart.”
“Everything you need to know is written in the candles.”
“Indicators lag, price action leads.”
“Trade what you see, not what you think.”
“Every candle tells a story. Learn to read it.”
💰Quotes:
“Support and resistance are the footprints of money.”
“A closed candle is a fact, an open candle is only a possibility.”
“The market doesn’t hide; it leaves clues in price action.”
“The best trades look obvious… after you’ve learned to see them.”
“Patterns are just human emotions drawn on a chart.”
4. Stop Loss
Let’s talk about the unsung hero of our trading strategy, the silent guardian, the watchful protector: the stop-loss.
Our Love-Hate Relationship with the Stop-Loss
Here at [Your Company/Team Name, or “our trading desk”], we’ve got a profound, albeit slightly complicated, relationship with the stop-loss. Think of it like that super-responsible friend who always makes sure you don’t do anything too stupid on a wild night out. You might grumble when they pull you away from that questionable decision, but you’re eternally grateful the next morning when you’re not missing an eyebrow.
That’s our stop-loss. It’s the designated driver for our trades, preventing us from driving our accounts straight into a ditch at 100 miles an hour while screaming, “It’s just a temporary dip! It’ll come back!” (Spoiler alert: it usually doesn’t, not without taking your entire portfolio with it.)
Why We Embrace the “Slightly Painful Nudge”
Some traders, bless their optimistic hearts, view a stop-loss as a personal insult, a sign of weakness, or perhaps a tiny financial guillotine. They’d rather ride a losing trade down to zero, hoping for a miraculous turnaround, like waiting for a flat tire to reinflate itself through sheer willpower.
Not us. We’ve learned that a small, controlled loss is like a tiny paper cut compared to the gaping financial wound of a blown-up account. When our stop-loss gets hit, it’s not a defeat; it’s the market gently (or sometimes firmly) nudging us with a sticky note that says, “Hey, genius, your idea was wrong. Time to exit and rethink your life choices… or at least your next trade.”
The Unspoken Benefits of Our Stop-Loss Obsession
Sleep: Believe it or not, knowing your downside is capped lets you actually close your eyes at night without visions of red numbers dancing in your head. It’s truly revolutionary.
Sanity: Less emotional attachment to a dying trade means fewer arguments with your spouse about why you’re glued to the screen muttering about “support levels.”
Capital Preservation: This is fancy talk for “not losing all your money.” Our stop-loss is like a tiny, vigilant bodyguard for our trading capital, always ready to step in and say, “Alright, that’s enough fun for today.”
The Freedom to Be Wrong (Often!): Since we accept small losses, we’re not afraid to try new things. We know that if a trade goes sideways, our trusty stop-loss will catch us before we fall into the abyss of regret.
So, yes, we use stop-losses. Not because we’re pessimists, but because we’re realists who prefer controlled exits over catastrophic explosions. And honestly, it leaves us with more money for coffee and other vital trading supplies
💰Quotes:
“Enter the trade — then sit on your hands like a monk!”
“We don’t click and panic. We click and chill.”
“Traders who wait, get paid. Traders who fidget… donate!”
“We enter the trade, then do absolutely nothing like pros.”
“Let the market work. You’re not its boss.”
💰Normal Tone Slogans:
“Enter with a plan, then let the trade play out.”
“The work is in the setup — the result comes with patience.”
“We don’t babysit trades. We trust our edge.”
“Entry is action. Waiting is discipline.”
“After entry, emotion has no place — only patience.”
The Power of PriceAction
What is Price Action?!
Price action is a trading methodology that analyzes the movement of an asset’s price over time to make trading decisions. It is the foundation of technical analysis and operates on the principle that all relevant market information—including economic news, investor sentiment, and fundamental data—is already reflected in the asset’s price.
Instead of relying on lagging technical indicators, traders who use price action focus on a “naked” or clean chart. By observing historical price data, they identify patterns, trends, and key levels to predict future price direction.The core concepts of price action analysis include:Support and Resistance
These are price levels where an asset’s price has historically paused or reversed direction. A support level is a price floor where buying pressure is strong enough to prevent the price from falling further. A resistance level is a price ceiling where selling pressure is sufficient to stop the price from rising higher.
Candlestick Patterns
Candlestick charts are a primary tool for price action traders. Each candlestick represents a specific period and shows the open, high, low, and closing prices. The shape and color of the candlesticks form patterns (e.g., Doji, Hammer, Engulfing) that provide insights into market sentiment and can signal potential reversals or continuations.
Trend Analysis
Price action traders identify the market’s trend by observing the sequence of highs and lows. An uptrend is characterized by a series of higher highs and higher lows, while a downtrend is marked by lower highs and lower lows. A break in this sequence can indicate a potential trend reversal.
💰Quotes:
“Price action is the only truth on the chart.”
“Everything you need to know is written in the candles.”
“Indicators lag, price action leads.”
“Trade what you see, not what you think.”
“Every candle tells a story. Learn to read it.”
💰Quotes:
“Support and resistance are the footprints of money.”
“A closed candle is a fact, an open candle is only a possibility.”
“The market doesn’t hide; it leaves clues in price action.”
“The best trades look obvious… after you’ve learned to see them.”
“Patterns are just human emotions drawn on a chart.”
The Power of PriceAction
💰What in the Kraken’s Name is Price Action?
Imagine you’re on a bustling market street, and everyone’s shouting their prices for pineapples. You don’t need a fancy economist with a spreadsheet to tell you if pineapples are getting more popular or less. You just watch what people are doing: are they eagerly snatching them up at higher prices, or are the vendors struggling to give them away?
Price action is exactly that, but for stocks and other assets! It’s simply reading the story the market is telling you directly through the price itself. No need for complicated, lagging indicators that are always a step behind, like a tired parrot squawking old news. You’re looking at the raw, unfiltered moves on your chart – the ultimate truth of supply and demand, fear and greed.
💰Why is it the Golden Compass of Trading?
Forget trying to navigate with a half-broken sextant! Price action is your North Star, your most reliable guide:
It’s the OG (Original Gangster) Signal: Every indicator you see on a chart is derived from price. Price action is the price. It’s the source code, the main event, the real deal. When you’re looking at price action, you’re getting the news straight from the horse’s mouth, not through a dozen gossipy villagers.
No Lag, Just Action! Imagine trying to surf a wave by looking at where the last wave broke. You’d be wiped out! Many indicators are “lagging,” meaning they tell you what already happened. Price action is live, in the moment, allowing you to catch the wave as it forms. This means quicker decisions, tighter entries, and less time being swept away by unexpected currents.
Simpler Than a Coconut Cocktail: You don’t need a supercomputer or a massive collection of complex tools. A clean chart, your trusty eyeballs, and a basic understanding of candlestick patterns are often all you need. This simplicity reduces overwhelm and helps you make clear, decisive calls without second-guessing.
The Trend is Your Best Mate! Remember that wise old saying, “the trend is your friend”? Price action is the ultimate wingman for spotting that friend! It’s super easy to see if the market is clearly sailing upwards (making higher highs and higher lows), diving downwards (lower lows and lower highs), or just bobbing around in the doldrums. If the trend is clear, you know exactly which direction to point your ship. If it’s messy, price action tells you to stay ashore and enjoy a pineapple smoothie!
💰How to Read the Market’s Secret Diary (The Candlesticks!)
Each little candle on your chart is like a tiny scroll, telling you a mini-story of what happened during that time period (a minute, an hour, a day).
The Body: This is the fat part of the candle. A long green (or white) body means buyers were in control, pushing the price way up. A long red (or black) body means sellers dominated, sending the price tumbling. Think of it as a tug-of-war: who won that round?
The Wicks (or Shadows): These thin lines sticking out from the top and bottom are like antennae, showing you how far the price tried to go but got rejected. A long upper wick means buyers tried to push it high but sellers dragged it back down. A long lower wick means sellers tried to push it low but buyers bravely picked it up. These wicks often whisper secrets about exhaustion or reversals!
By watching how these candles form patterns – like a “Hammer” hitting rock bottom and bouncing back up (a sign of buyers coming to the rescue!), or an “Engulfing” pattern where one big candle swallows the previous one (a dramatic shift in power!) – you start to predict where the currents might take you next.
So, next time you’re charting your course, clear your deck, breathe in that salty air, and let the price action speak to you. It’s the most direct, most powerful, and frankly, the most fun way to understand what’s truly happening in the market and chart your way to potential success!
💰Quotes:
“Price action is the only truth on the chart.”
“Everything you need to know is written in the candles.”
“Indicators lag, price action leads.”
“Trade what you see, not what you think.”
“Every candle tells a story. Learn to read it.”
💰Quotes:
“Support and resistance are the footprints of money.”
“A closed candle is a fact, an open candle is only a possibility.”
“The market doesn’t hide; it leaves clues in price action.”
“The best trades look obvious… after you’ve learned to see them.”
“Patterns are just human emotions drawn on a chart.”
💰Quotes:
“Price action: the art of staring at candles until they confess.”
“Indicators are like rumors; price action is the witness.”
“Trading without price action is like driving blindfolded.”
“Sometimes the best trade is to just let the candle close.”
“If you can’t find the trend, step back and squint—price action is waving at you.”
💰Quotes:
“Enter the trade — then sit on your hands like a monk!”
“We don’t click and panic. We click and chill.”
“Traders who wait, get paid. Traders who fidget… donate!”
“We enter the trade, then do absolutely nothing like pros.”
“Let the market work. You’re not its boss.”
💰Quotes:
“Enter the trade — then sit on your hands like a monk!”
“We don’t click and panic. We click and chill.”
“Traders who wait, get paid. Traders who fidget… donate!”
“We enter the trade, then do absolutely nothing like pros.”
“Let the market work. You’re not its boss.”
💰Quotes:
“Enter the trade — then sit on your hands like a monk!”
“We don’t click and panic. We click and chill.”
“Traders who wait, get paid. Traders who fidget… donate!”
“We enter the trade, then do absolutely nothing like pros.”
“Let the market work. You’re not its boss.”
Add Your Heading Text Here
The Power of PriceAction
What is Price Action?!
Price action is a trading methodology that analyzes the movement of an asset’s price over time to make trading decisions. It is the foundation of technical analysis and operates on the principle that all relevant market information—including economic news, investor sentiment, and fundamental data—is already reflected in the asset’s price.
Instead of relying on lagging technical indicators, traders who use price action focus on a “naked” or clean chart. By observing historical price data, they identify patterns, trends, and key levels to predict future price direction.The core concepts of price action analysis include:Support and Resistance
These are price levels where an asset’s price has historically paused or reversed direction. A support level is a price floor where buying pressure is strong enough to prevent the price from falling further. A resistance level is a price ceiling where selling pressure is sufficient to stop the price from rising higher.
Candlestick Patterns
Candlestick charts are a primary tool for price action traders. Each candlestick represents a specific period and shows the open, high, low, and closing prices. The shape and color of the candlesticks form patterns (e.g., Doji, Hammer, Engulfing) that provide insights into market sentiment and can signal potential reversals or continuations.
Trend Analysis
Price action traders identify the market’s trend by observing the sequence of highs and lows. An uptrend is characterized by a series of higher highs and higher lows, while a downtrend is marked by lower highs and lower lows. A break in this sequence can indicate a potential trend reversal.
💰Quotes:
“Price action is the only truth on the chart.”
“Everything you need to know is written in the candles.”
“Indicators lag, price action leads.”
“Trade what you see, not what you think.”
“Every candle tells a story. Learn to read it.”
💰Quotes:
“Support and resistance are the footprints of money.”
“A closed candle is a fact, an open candle is only a possibility.”
“The market doesn’t hide; it leaves clues in price action.”
“The best trades look obvious… after you’ve learned to see them.”
“Patterns are just human emotions drawn on a chart.”
12. The Power of EMA

Alright, gather ’round, market comedians and aspiring chart jesters! Let’s talk about the EMA, or the Exponential Moving Average, which sounds like a spell from Harry Potter, but is actually just a fancy way of saying: “This average is a little bit obsessed with the present moment.”
Imagine you’re judging a singing competition, and the contestants are daily stock prices.
Tray A (The Simple Moving Average, or SMA): This judge is fair, maybe too fair. They listen to every single singer from the last 50 days (or whatever period you choose), and they give them all equal marks. The diva from two months ago gets the same score weight as today’s fresh-faced talent. It’s democratic, but sometimes a bit slow to react when a real superstar (or a total disaster) walks on stage today. “Oh, that last singer was incredible!” the SMA says, “But let’s not forget that average performance from 48 days ago. It all counts equally!” Yawn.
Tray B (The Exponential Moving Average, or EMA): Now, this judge? This judge is current. They’re all about “what have you done for me lately?” They still consider past performances, sure, but they’re way more impressed by the amazing (or terrible) singer who just finished their set. Today’s performance gets a huge chunk of their attention, yesterday’s gets a good chunk, and the further back you go, the less they care. “Oh, wow, that vocal run just now! That’s what I’m talking about!” the EMA exclaims, barely remembering that off-key warble from three weeks ago.
So, why is our EMA judge such a drama queen about recent data?
Because in the frantic, caffeine-fueled world of trading, sometimes you need an average that’s got its ear to the ground. If prices are starting to climb like a cat up a palm tree in Barcelona (it’s Friday, July 4th, 2025, after all, and the sun is blazing!), the EMA will notice that upward shift faster than its old-school SMA cousin. It’ll start curving upwards, basically shouting, “Hey! Something’s happening now!”
When do you want this attention-seeking average?
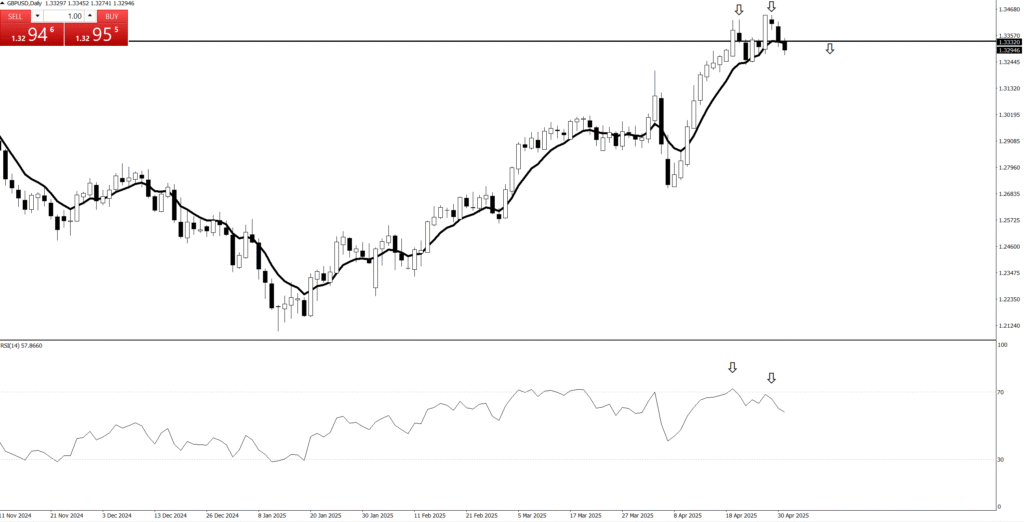
Spotting Trends (like a fashion blogger): If the price line is dancing consistently above the EMA line, it’s like the market is saying, “We’re trendy! We’re going up!” If it’s below, well, put on your sad flamenco music, because things are heading down.
Catching Crossovers (like a high-five between lines): Traders often use two EMAs, a fast one (like our hyperactive judge, maybe 9 days) and a slow one (still cares about recent, but a bit more chill, say 50 days). When the fast EMA crosses above the slow EMA, it’s like they’re high-fiving and shouting “BUY!” When the fast one crosses below, it’s a “SELL!” signal, perhaps with a dramatic sigh.
In short, the EMA is the moving average that’s always checking its phone for the latest updates. It’s responsive, a bit excitable, and perfect for traders who want to feel the pulse of the market now, not just appreciate its entire life story. Just remember, like all excitable friends, it can sometimes get a little too hyped and give you a false alarm in a messy market. So, always use it with a pinch of salt… or maybe some delicious Spanish olives!
💰Quotes:
“Enter the trade — then sit on your hands like a monk!”
“We don’t click and panic. We click and chill.”
“Traders who wait, get paid. Traders who fidget… donate!”
“We enter the trade, then do absolutely nothing like pros.”
“Let the market work. You’re not its boss.”
💰Normal Tone Slogans:
“Enter with a plan, then let the trade play out.”
“The work is in the setup — the result comes with patience.”
“We don’t babysit trades. We trust our edge.”
“Entry is action. Waiting is discipline.”
“After entry, emotion has no place — only patience.”
12. The Power of EMA
Alright, gather ’round, market comedians and aspiring chart jesters! Let’s talk about the EMA, or the Exponential Moving Average, which sounds like a spell from Harry Potter, but is actually just a fancy way of saying: “This average is a little bit obsessed with the present moment.”
Imagine you’re judging a singing competition, and the contestants are daily stock prices.
Tray A (The Simple Moving Average, or SMA): This judge is fair, maybe too fair. They listen to every single singer from the last 50 days (or whatever period you choose), and they give them all equal marks. The diva from two months ago gets the same score weight as today’s fresh-faced talent. It’s democratic, but sometimes a bit slow to react when a real superstar (or a total disaster) walks on stage today. “Oh, that last singer was incredible!” the SMA says, “But let’s not forget that average performance from 48 days ago. It all counts equally!” Yawn.
Tray B (The Exponential Moving Average, or EMA): Now, this judge? This judge is current. They’re all about “what have you done for me lately?” They still consider past performances, sure, but they’re way more impressed by the amazing (or terrible) singer who just finished their set. Today’s performance gets a huge chunk of their attention, yesterday’s gets a good chunk, and the further back you go, the less they care. “Oh, wow, that vocal run just now! That’s what I’m talking about!” the EMA exclaims, barely remembering that off-key warble from three weeks ago.
So, why is our EMA judge such a drama queen about recent data?
Because in the frantic, caffeine-fueled world of trading, sometimes you need an average that’s got its ear to the ground. If prices are starting to climb like a cat up a palm tree in Barcelona (it’s Friday, July 4th, 2025, after all, and the sun is blazing!), the EMA will notice that upward shift faster than its old-school SMA cousin. It’ll start curving upwards, basically shouting, “Hey! Something’s happening now!”
When do you want this attention-seeking average?
Spotting Trends (like a fashion blogger): If the price line is dancing consistently above the EMA line, it’s like the market is saying, “We’re trendy! We’re going up!” If it’s below, well, put on your sad flamenco music, because things are heading down.
Catching Crossovers (like a high-five between lines): Traders often use two EMAs, a fast one (like our hyperactive judge, maybe 9 days) and a slow one (still cares about recent, but a bit more chill, say 50 days). When the fast EMA crosses above the slow EMA, it’s like they’re high-fiving and shouting “BUY!” When the fast one crosses below, it’s a “SELL!” signal, perhaps with a dramatic sigh.
In short, the EMA is the moving average that’s always checking its phone for the latest updates. It’s responsive, a bit excitable, and perfect for traders who want to feel the pulse of the market now, not just appreciate its entire life story. Just remember, like all excitable friends, it can sometimes get a little too hyped and give you a false alarm in a messy market. So, always use it with a pinch of salt… or maybe some delicious Spanish olives!
💰Quotes:
“Enter the trade — then sit on your hands like a monk!”
“We don’t click and panic. We click and chill.”
“Traders who wait, get paid. Traders who fidget… donate!”
“We enter the trade, then do absolutely nothing like pros.”
“Let the market work. You’re not its boss.”
💰Normal Tone Slogans:
“Enter with a plan, then let the trade play out.”
“The work is in the setup — the result comes with patience.”
“We don’t babysit trades. We trust our edge.”
“Entry is action. Waiting is discipline.”
“After entry, emotion has no place — only patience.”
The Power of EMA
Alright, gather ’round, market comedians and aspiring chart jesters! Let’s talk about the EMA, or the Exponential Moving Average, which sounds like a spell from Harry Potter, but is actually just a fancy way of saying: “This average is a little bit obsessed with the present moment.”
Imagine you’re judging a singing competition, and the contestants are daily stock prices.
Tray A (The Simple Moving Average, or SMA): This judge is fair, maybe too fair. They listen to every single singer from the last 50 days (or whatever period you choose), and they give them all equal marks. The diva from two months ago gets the same score weight as today’s fresh-faced talent. It’s democratic, but sometimes a bit slow to react when a real superstar (or a total disaster) walks on stage today. “Oh, that last singer was incredible!” the SMA says, “But let’s not forget that average performance from 48 days ago. It all counts equally!” Yawn.
Tray B (The Exponential Moving Average, or EMA): Now, this judge? This judge is current. They’re all about “what have you done for me lately?” They still consider past performances, sure, but they’re way more impressed by the amazing (or terrible) singer who just finished their set. Today’s performance gets a huge chunk of their attention, yesterday’s gets a good chunk, and the further back you go, the less they care. “Oh, wow, that vocal run just now! That’s what I’m talking about!” the EMA exclaims, barely remembering that off-key warble from three weeks ago.
So, why is our EMA judge such a drama queen about recent data?
Because in the frantic, caffeine-fueled world of trading, sometimes you need an average that’s got its ear to the ground. If prices are starting to climb like a cat up a palm tree in Barcelona (it’s Friday, July 4th, 2025, after all, and the sun is blazing!), the EMA will notice that upward shift faster than its old-school SMA cousin. It’ll start curving upwards, basically shouting, “Hey! Something’s happening now!”
When do you want this attention-seeking average?
Spotting Trends (like a fashion blogger): If the price line is dancing consistently above the EMA line, it’s like the market is saying, “We’re trendy! We’re going up!” If it’s below, well, put on your sad flamenco music, because things are heading down.
Catching Crossovers (like a high-five between lines): Traders often use two EMAs, a fast one (like our hyperactive judge, maybe 9 days) and a slow one (still cares about recent, but a bit more chill, say 50 days). When the fast EMA crosses above the slow EMA, it’s like they’re high-fiving and shouting “BUY!” When the fast one crosses below, it’s a “SELL!” signal, perhaps with a dramatic sigh.
In short, the EMA is the moving average that’s always checking its phone for the latest updates. It’s responsive, a bit excitable, and perfect for traders who want to feel the pulse of the market now, not just appreciate its entire life story. Just remember, like all excitable friends, it can sometimes get a little too hyped and give you a false alarm in a messy market. So, always use it with a pinch of salt… or maybe some delicious Spanish olives!
💰Quotes:
-
“Enter the trade — then sit on your hands like a monk!”
-
“We don’t click and panic. We click and chill.”
-
“Traders who wait, get paid. Traders who fidget… donate!”
-
“We enter the trade, then do absolutely nothing like pros.”
-
“Let the market work. You’re not its boss.”
💰Quotes:
-
“Enter the trade — then sit on your hands like a monk!”
-
“We don’t click and panic. We click and chill.”
-
“Traders who wait, get paid. Traders who fidget… donate!”
-
“We enter the trade, then do absolutely nothing like pros.”
-
“Let the market work. You’re not its boss.”
The Power of EMA
💰What in the Kraken’s Name is Price Action?
Imagine you’re on a bustling market street, and everyone’s shouting their prices for pineapples. You don’t need a fancy economist with a spreadsheet to tell you if pineapples are getting more popular or less. You just watch what people are doing: are they eagerly snatching them up at higher prices, or are the vendors struggling to give them away?
Price action is exactly that, but for stocks and other assets! It’s simply reading the story the market is telling you directly through the price itself. No need for complicated, lagging indicators that are always a step behind, like a tired parrot squawking old news. You’re looking at the raw, unfiltered moves on your chart – the ultimate truth of supply and demand, fear and greed.
💰Why is it the Golden Compass of Trading?
Forget trying to navigate with a half-broken sextant! Price action is your North Star, your most reliable guide:
It’s the OG (Original Gangster) Signal: Every indicator you see on a chart is derived from price. Price action is the price. It’s the source code, the main event, the real deal. When you’re looking at price action, you’re getting the news straight from the horse’s mouth, not through a dozen gossipy villagers.
No Lag, Just Action! Imagine trying to surf a wave by looking at where the last wave broke. You’d be wiped out! Many indicators are “lagging,” meaning they tell you what already happened. Price action is live, in the moment, allowing you to catch the wave as it forms. This means quicker decisions, tighter entries, and less time being swept away by unexpected currents.
Simpler Than a Coconut Cocktail: You don’t need a supercomputer or a massive collection of complex tools. A clean chart, your trusty eyeballs, and a basic understanding of candlestick patterns are often all you need. This simplicity reduces overwhelm and helps you make clear, decisive calls without second-guessing.
The Trend is Your Best Mate! Remember that wise old saying, “the trend is your friend”? Price action is the ultimate wingman for spotting that friend! It’s super easy to see if the market is clearly sailing upwards (making higher highs and higher lows), diving downwards (lower lows and lower highs), or just bobbing around in the doldrums. If the trend is clear, you know exactly which direction to point your ship. If it’s messy, price action tells you to stay ashore and enjoy a pineapple smoothie!
💰How to Read the Market’s Secret Diary (The Candlesticks!)
Each little candle on your chart is like a tiny scroll, telling you a mini-story of what happened during that time period (a minute, an hour, a day).
The Body: This is the fat part of the candle. A long green (or white) body means buyers were in control, pushing the price way up. A long red (or black) body means sellers dominated, sending the price tumbling. Think of it as a tug-of-war: who won that round?
The Wicks (or Shadows): These thin lines sticking out from the top and bottom are like antennae, showing you how far the price tried to go but got rejected. A long upper wick means buyers tried to push it high but sellers dragged it back down. A long lower wick means sellers tried to push it low but buyers bravely picked it up. These wicks often whisper secrets about exhaustion or reversals!
By watching how these candles form patterns – like a “Hammer” hitting rock bottom and bouncing back up (a sign of buyers coming to the rescue!), or an “Engulfing” pattern where one big candle swallows the previous one (a dramatic shift in power!) – you start to predict where the currents might take you next.
So, next time you’re charting your course, clear your deck, breathe in that salty air, and let the price action speak to you. It’s the most direct, most powerful, and frankly, the most fun way to understand what’s truly happening in the market and chart your way to potential success!
💰Quotes:
“Enter the trade — then sit on your hands like a monk!”
“We don’t click and panic. We click and chill.”
“Traders who wait, get paid. Traders who fidget… donate!”
“We enter the trade, then do absolutely nothing like pros.”
“Let the market work. You’re not its boss.”
💰Quotes:
-
“Enter the trade — then sit on your hands like a monk!”
-
“We don’t click and panic. We click and chill.”
-
“Traders who wait, get paid. Traders who fidget… donate!”
-
“We enter the trade, then do absolutely nothing like pros.”
-
“Let the market work. You’re not its boss.”