4. Stop Loss
False Break: The Market’s Mean-Spirited Prank (That Makes You Money)
Let’s talk about one of the most exciting and profitable moments in trading: the False Breakout. You know it well. Price hits a key support or resistance level, looks like it’s going to punch right through, and then—BAM!—it snaps back like a scorned lover.
Most amateur traders curse the market for “shaking them out.” Professionals, however, see the False Break for what it is: a screaming, neon-sign invitation to make some serious cash.
The “Why You Got Fooled” Explanation
A False Break is the market’s way of playing a practical joke on the impatient. When price approaches a major level (like a strong support floor or resistance ceiling), two things happen:
Amateurs Get Greedy: Traders rush in, placing “breakout” orders, convinced the level will crack. They jump the gun, assuming the momentum is a done deal.
The “Big Money” Gets Sneaky: Institutional traders and larger players see all those stop-losses clustered just outside the level. They push the price just far enough to trigger those amateur stop-losses (taking their liquidity) and then immediately reverse the price. It’s a calculated, ruthless, and highly effective trap.
The Power of the Reversal
The true power of the False Break is the sudden, violent force of the reversal. When the price snaps back inside the key level:
The Trapped are Panicking: All those amateurs who bought the fake breakout are now losing money and are forced to exit their trades—which actually provides extra fuel for the reversal.
The Direction is Confirmed: The market has rejected the direction of the break. It clearly didn’t want to go lower than that support (Bullish False Break), or higher than that resistance (Bearish False Break). This gives you a high-probability trade entry in the opposite direction.
This pattern allows you to enter the market with confidence, knowing that the most vulnerable traders have just been flushed out. You are not fighting the market; you are entering precisely at the point of maximum confusion and minimum resistance, resulting in excellent Risk/Reward Ratios. It’s not about predicting the future; it’s about capitalizing on the present panic!
💰Quotes:
“Enter the trade — then sit on your hands like a monk!”
“We don’t click and panic. We click and chill.”
“Traders who wait, get paid. Traders who fidget… donate!”
“We enter the trade, then do absolutely nothing like pros.”
“Let the market work. You’re not its boss.”
💰Normal Tone Slogans:
“Enter with a plan, then let the trade play out.”
“The work is in the setup — the result comes with patience.”
“We don’t babysit trades. We trust our edge.”
“Entry is action. Waiting is discipline.”
“After entry, emotion has no place — only patience.”

4. Stop Loss
Your Profitable Betrayal: The Power of the False Break!
Stop falling for the market’s tricks! If you’ve ever had a trade look perfect—breaking a key level—only to see it immediately reverse and stop you out, you’ve been a victim of the False Breakout.
Here’s the exciting news: the False Break is not a problem; it’s a high-octane trading opportunity! Mastering this single pattern is the key to transforming from a constantly-fooled amateur into a professional who profits from other people’s misfortune.
The Market’s Rube Goldberg Machine
A False Break is essentially the market performing a highly deceptive magic trick. It occurs when price temporarily moves past a crucial line (like Support or Resistance), lures in a crowd, and then sharply reverses.
Why does this happen? It’s a calculated trap set by the big players to grab liquidity and crush premature entries:
The Bait: Amateurs, using simple “breakout” strategies, see the price cross the line and rush in, convinced the trend is confirmed.
The Hook: Their entry orders and their stop-losses (often placed just on the other side of the original level) are now exposed.
The Snap: The price is deliberately pushed just far enough to trigger those amateur stop-losses. Once the big players have collected the liquidity they need, they reverse the price violently.
The Power of Trading the Trap
For you, the professional, the False Break is a gift. It instantly confirms two vital things:
The Level is Real: The reversal proves that the key support or resistance level still matters. The market clearly rejected the attempt to move past it.
Momentum is Strong: The sharp reversal is fueled by the panicked exit (forced stop-losses) of all the trapped traders. Their pain becomes your momentum!
If you see a Bullish False Break (price fakes a move down, then reverses up), you know the sellers are trapped, and the price is now likely to surge higher. You get a fantastic, low-risk entry with a clear target and a very tight stop-loss (placed just beyond the reversal wick).
You are essentially trading the maximum pain point of the market. Stop chasing the break; wait for the betrayal. When the market plays its cruel joke, be the professional who shows up to collect the ransom! That’s how you turn failure into profit.
💰Quotes:
“Enter the trade — then sit on your hands like a monk!”
“We don’t click and panic. We click and chill.”
“Traders who wait, get paid. Traders who fidget… donate!”
“We enter the trade, then do absolutely nothing like pros.”
“Let the market work. You’re not its boss.”
💰Normal Tone Slogans:
“Enter with a plan, then let the trade play out.”
“The work is in the setup — the result comes with patience.”
“We don’t babysit trades. We trust our edge.”
“Entry is action. Waiting is discipline.”
“After entry, emotion has no place — only patience.”
The Power of StopLoss


What is Price Action?!
Price action is a trading methodology that analyzes the movement of an asset’s price over time to make trading decisions. It is the foundation of technical analysis and operates on the principle that all relevant market information—including economic news, investor sentiment, and fundamental data—is already reflected in the asset’s price.
Instead of relying on lagging technical indicators, traders who use price action focus on a “naked” or clean chart. By observing historical price data, they identify patterns, trends, and key levels to predict future price direction.The core concepts of price action analysis include:Support and Resistance
These are price levels where an asset’s price has historically paused or reversed direction. A support level is a price floor where buying pressure is strong enough to prevent the price from falling further. A resistance level is a price ceiling where selling pressure is sufficient to stop the price from rising higher.
Candlestick Patterns
Candlestick charts are a primary tool for price action traders. Each candlestick represents a specific period and shows the open, high, low, and closing prices. The shape and color of the candlesticks form patterns (e.g., Doji, Hammer, Engulfing) that provide insights into market sentiment and can signal potential reversals or continuations.
Trend Analysis
Price action traders identify the market’s trend by observing the sequence of highs and lows. An uptrend is characterized by a series of higher highs and higher lows, while a downtrend is marked by lower highs and lower lows. A break in this sequence can indicate a potential trend reversal.
💰Quotes:
“Price action is the only truth on the chart.”
“Everything you need to know is written in the candles.”
“Indicators lag, price action leads.”
“Trade what you see, not what you think.”
“Every candle tells a story. Learn to read it.”
💰Quotes:
“Support and resistance are the footprints of money.”
“A closed candle is a fact, an open candle is only a possibility.”
“The market doesn’t hide; it leaves clues in price action.”
“The best trades look obvious… after you’ve learned to see them.”
“Patterns are just human emotions drawn on a chart.”
The Power of StopLoss
What is Price Action?!
Price action is a trading methodology that analyzes the movement of an asset’s price over time to make trading decisions. It is the foundation of technical analysis and operates on the principle that all relevant market information—including economic news, investor sentiment, and fundamental data—is already reflected in the asset’s price.
Instead of relying on lagging technical indicators, traders who use price action focus on a “naked” or clean chart. By observing historical price data, they identify patterns, trends, and key levels to predict future price direction.The core concepts of price action analysis include:Support and Resistance
These are price levels where an asset’s price has historically paused or reversed direction. A support level is a price floor where buying pressure is strong enough to prevent the price from falling further. A resistance level is a price ceiling where selling pressure is sufficient to stop the price from rising higher.
Candlestick Patterns
Candlestick charts are a primary tool for price action traders. Each candlestick represents a specific period and shows the open, high, low, and closing prices. The shape and color of the candlesticks form patterns (e.g., Doji, Hammer, Engulfing) that provide insights into market sentiment and can signal potential reversals or continuations.
Trend Analysis
Price action traders identify the market’s trend by observing the sequence of highs and lows. An uptrend is characterized by a series of higher highs and higher lows, while a downtrend is marked by lower highs and lower lows. A break in this sequence can indicate a potential trend reversal.
💰Quotes:
“Price action is the only truth on the chart.”
“Everything you need to know is written in the candles.”
“Indicators lag, price action leads.”
“Trade what you see, not what you think.”
“Every candle tells a story. Learn to read it.”
💰Quotes:
“Support and resistance are the footprints of money.”
“A closed candle is a fact, an open candle is only a possibility.”
“The market doesn’t hide; it leaves clues in price action.”
“The best trades look obvious… after you’ve learned to see them.”
“Patterns are just human emotions drawn on a chart.”
The Power of PriceAction
💰What in the Kraken’s Name is Price Action?
Imagine you’re on a bustling market street, and everyone’s shouting their prices for pineapples. You don’t need a fancy economist with a spreadsheet to tell you if pineapples are getting more popular or less. You just watch what people are doing: are they eagerly snatching them up at higher prices, or are the vendors struggling to give them away?
Price action is exactly that, but for stocks and other assets! It’s simply reading the story the market is telling you directly through the price itself. No need for complicated, lagging indicators that are always a step behind, like a tired parrot squawking old news. You’re looking at the raw, unfiltered moves on your chart – the ultimate truth of supply and demand, fear and greed.
💰Why is it the Golden Compass of Trading?
Forget trying to navigate with a half-broken sextant! Price action is your North Star, your most reliable guide:
It’s the OG (Original Gangster) Signal: Every indicator you see on a chart is derived from price. Price action is the price. It’s the source code, the main event, the real deal. When you’re looking at price action, you’re getting the news straight from the horse’s mouth, not through a dozen gossipy villagers.
No Lag, Just Action! Imagine trying to surf a wave by looking at where the last wave broke. You’d be wiped out! Many indicators are “lagging,” meaning they tell you what already happened. Price action is live, in the moment, allowing you to catch the wave as it forms. This means quicker decisions, tighter entries, and less time being swept away by unexpected currents.
Simpler Than a Coconut Cocktail: You don’t need a supercomputer or a massive collection of complex tools. A clean chart, your trusty eyeballs, and a basic understanding of candlestick patterns are often all you need. This simplicity reduces overwhelm and helps you make clear, decisive calls without second-guessing.
The Trend is Your Best Mate! Remember that wise old saying, “the trend is your friend”? Price action is the ultimate wingman for spotting that friend! It’s super easy to see if the market is clearly sailing upwards (making higher highs and higher lows), diving downwards (lower lows and lower highs), or just bobbing around in the doldrums. If the trend is clear, you know exactly which direction to point your ship. If it’s messy, price action tells you to stay ashore and enjoy a pineapple smoothie!
💰How to Read the Market’s Secret Diary (The Candlesticks!)
Each little candle on your chart is like a tiny scroll, telling you a mini-story of what happened during that time period (a minute, an hour, a day).
The Body: This is the fat part of the candle. A long green (or white) body means buyers were in control, pushing the price way up. A long red (or black) body means sellers dominated, sending the price tumbling. Think of it as a tug-of-war: who won that round?
The Wicks (or Shadows): These thin lines sticking out from the top and bottom are like antennae, showing you how far the price tried to go but got rejected. A long upper wick means buyers tried to push it high but sellers dragged it back down. A long lower wick means sellers tried to push it low but buyers bravely picked it up. These wicks often whisper secrets about exhaustion or reversals!
By watching how these candles form patterns – like a “Hammer” hitting rock bottom and bouncing back up (a sign of buyers coming to the rescue!), or an “Engulfing” pattern where one big candle swallows the previous one (a dramatic shift in power!) – you start to predict where the currents might take you next.
So, next time you’re charting your course, clear your deck, breathe in that salty air, and let the price action speak to you. It’s the most direct, most powerful, and frankly, the most fun way to understand what’s truly happening in the market and chart your way to potential success!
💰Quotes:
“Price action is the only truth on the chart.”
“Everything you need to know is written in the candles.”
“Indicators lag, price action leads.”
“Trade what you see, not what you think.”
“Every candle tells a story. Learn to read it.”
💰Quotes:
“Support and resistance are the footprints of money.”
“A closed candle is a fact, an open candle is only a possibility.”
“The market doesn’t hide; it leaves clues in price action.”
“The best trades look obvious… after you’ve learned to see them.”
“Patterns are just human emotions drawn on a chart.”
💰Quotes:
“Price action: the art of staring at candles until they confess.”
“Indicators are like rumors; price action is the witness.”
“Trading without price action is like driving blindfolded.”
“Sometimes the best trade is to just let the candle close.”
“If you can’t find the trend, step back and squint—price action is waving at you.”
💰Quotes:
“Enter the trade — then sit on your hands like a monk!”
“We don’t click and panic. We click and chill.”
“Traders who wait, get paid. Traders who fidget… donate!”
“We enter the trade, then do absolutely nothing like pros.”
“Let the market work. You’re not its boss.”
💰Quotes:
“Enter the trade — then sit on your hands like a monk!”
“We don’t click and panic. We click and chill.”
“Traders who wait, get paid. Traders who fidget… donate!”
“We enter the trade, then do absolutely nothing like pros.”
“Let the market work. You’re not its boss.”
💰Quotes:
“Enter the trade — then sit on your hands like a monk!”
“We don’t click and panic. We click and chill.”
“Traders who wait, get paid. Traders who fidget… donate!”
“We enter the trade, then do absolutely nothing like pros.”
“Let the market work. You’re not its boss.”
Add Your Heading Text Here
The Power of PriceAction
What is Price Action?!
Price action is a trading methodology that analyzes the movement of an asset’s price over time to make trading decisions. It is the foundation of technical analysis and operates on the principle that all relevant market information—including economic news, investor sentiment, and fundamental data—is already reflected in the asset’s price.
Instead of relying on lagging technical indicators, traders who use price action focus on a “naked” or clean chart. By observing historical price data, they identify patterns, trends, and key levels to predict future price direction.The core concepts of price action analysis include:Support and Resistance
These are price levels where an asset’s price has historically paused or reversed direction. A support level is a price floor where buying pressure is strong enough to prevent the price from falling further. A resistance level is a price ceiling where selling pressure is sufficient to stop the price from rising higher.
Candlestick Patterns
Candlestick charts are a primary tool for price action traders. Each candlestick represents a specific period and shows the open, high, low, and closing prices. The shape and color of the candlesticks form patterns (e.g., Doji, Hammer, Engulfing) that provide insights into market sentiment and can signal potential reversals or continuations.
Trend Analysis
Price action traders identify the market’s trend by observing the sequence of highs and lows. An uptrend is characterized by a series of higher highs and higher lows, while a downtrend is marked by lower highs and lower lows. A break in this sequence can indicate a potential trend reversal.
💰Quotes:
“Price action is the only truth on the chart.”
“Everything you need to know is written in the candles.”
“Indicators lag, price action leads.”
“Trade what you see, not what you think.”
“Every candle tells a story. Learn to read it.”
💰Quotes:
“Support and resistance are the footprints of money.”
“A closed candle is a fact, an open candle is only a possibility.”
“The market doesn’t hide; it leaves clues in price action.”
“The best trades look obvious… after you’ve learned to see them.”
“Patterns are just human emotions drawn on a chart.”
Price Action: From Chaos to Clarity

💰What in the Kraken’s Name is Price Action?
Imagine you’re on a bustling market street, and everyone’s shouting their prices for pineapples. You don’t need a fancy economist with a spreadsheet to tell you if pineapples are getting more popular or less. You just watch what people are doing: are they eagerly snatching them up at higher prices, or are the vendors struggling to give them away?
Price action is exactly that, but for stocks and other assets! It’s simply reading the story the market is telling you directly through the price itself. No need for complicated, lagging indicators that are always a step behind, like a tired parrot squawking old news. You’re looking at the raw, unfiltered moves on your chart – the ultimate truth of supply and demand, fear and greed.
💰Why is it the Golden Compass of Trading?
Forget trying to navigate with a half-broken sextant! Price action is your North Star, your most reliable guide:
It’s the OG (Original Gangster) Signal: Every indicator you see on a chart is derived from price. Price action is the price. It’s the source code, the main event, the real deal. When you’re looking at price action, you’re getting the news straight from the horse’s mouth, not through a dozen gossipy villagers.
No Lag, Just Action! Imagine trying to surf a wave by looking at where the last wave broke. You’d be wiped out! Many indicators are “lagging,” meaning they tell you what already happened. Price action is live, in the moment, allowing you to catch the wave as it forms. This means quicker decisions, tighter entries, and less time being swept away by unexpected currents.
Simpler Than a Coconut Cocktail: You don’t need a supercomputer or a massive collection of complex tools. A clean chart, your trusty eyeballs, and a basic understanding of candlestick patterns are often all you need. This simplicity reduces overwhelm and helps you make clear, decisive calls without second-guessing.
The Trend is Your Best Mate! Remember that wise old saying, “the trend is your friend”? Price action is the ultimate wingman for spotting that friend! It’s super easy to see if the market is clearly sailing upwards (making higher highs and higher lows), diving downwards (lower lows and lower highs), or just bobbing around in the doldrums. If the trend is clear, you know exactly which direction to point your ship. If it’s messy, price action tells you to stay ashore and enjoy a pineapple smoothie!
💰How to Read the Market’s Secret Diary (The Candlesticks!)
Each little candle on your chart is like a tiny scroll, telling you a mini-story of what happened during that time period (a minute, an hour, a day).
The Body: This is the fat part of the candle. A long green (or white) body means buyers were in control, pushing the price way up. A long red (or black) body means sellers dominated, sending the price tumbling. Think of it as a tug-of-war: who won that round?
The Wicks (or Shadows): These thin lines sticking out from the top and bottom are like antennae, showing you how far the price tried to go but got rejected. A long upper wick means buyers tried to push it high but sellers dragged it back down. A long lower wick means sellers tried to push it low but buyers bravely picked it up. These wicks often whisper secrets about exhaustion or reversals!
By watching how these candles form patterns – like a “Hammer” hitting rock bottom and bouncing back up (a sign of buyers coming to the rescue!), or an “Engulfing” pattern where one big candle swallows the previous one (a dramatic shift in power!) – you start to predict where the currents might take you next.
So, next time you’re charting your course, clear your deck, breathe in that salty air, and let the price action speak to you. It’s the most direct, most powerful, and frankly, the most fun way to understand what’s truly happening in the market and chart your way to potential success!
💰Quotes:
“Enter the trade — then sit on your hands like a monk!”
“We don’t click and panic. We click and chill.”
“Traders who wait, get paid. Traders who fidget… donate!”
“We enter the trade, then do absolutely nothing like pros.”
“Let the market work. You’re not its boss.”
💰Normal Tone Slogans:
“Enter with a plan, then let the trade play out.”
“The work is in the setup — the result comes with patience.”
“We don’t babysit trades. We trust our edge.”
“Entry is action. Waiting is discipline.”
“After entry, emotion has no place — only patience.”
The Power of PriceAction

What is Price Action?!
Price action is a trading methodology that analyzes the movement of an asset’s price over time to make trading decisions. It is the foundation of technical analysis and operates on the principle that all relevant market information—including economic news, investor sentiment, and fundamental data—is already reflected in the asset’s price.
Instead of relying on lagging technical indicators, traders who use price action focus on a “naked” or clean chart. By observing historical price data, they identify patterns, trends, and key levels to predict future price direction.The core concepts of price action analysis include:Support and Resistance
These are price levels where an asset’s price has historically paused or reversed direction. A support level is a price floor where buying pressure is strong enough to prevent the price from falling further. A resistance level is a price ceiling where selling pressure is sufficient to stop the price from rising higher.
Candlestick Patterns
Candlestick charts are a primary tool for price action traders. Each candlestick represents a specific period and shows the open, high, low, and closing prices. The shape and color of the candlesticks form patterns (e.g., Doji, Hammer, Engulfing) that provide insights into market sentiment and can signal potential reversals or continuations.
Trend Analysis
Price action traders identify the market’s trend by observing the sequence of highs and lows. An uptrend is characterized by a series of higher highs and higher lows, while a downtrend is marked by lower highs and lower lows. A break in this sequence can indicate a potential trend reversal.
The Power of PriceAction
What is Price Action?!
Price action is a trading methodology that analyzes the movement of an asset’s price over time to make trading decisions. It is the foundation of technical analysis and operates on the principle that all relevant market information—including economic news, investor sentiment, and fundamental data—is already reflected in the asset’s price.
Instead of relying on lagging technical indicators, traders who use price action focus on a “naked” or clean chart. By observing historical price data, they identify patterns, trends, and key levels to predict future price direction.The core concepts of price action analysis include:Support and Resistance
These are price levels where an asset’s price has historically paused or reversed direction. A support level is a price floor where buying pressure is strong enough to prevent the price from falling further. A resistance level is a price ceiling where selling pressure is sufficient to stop the price from rising higher.
Candlestick Patterns
Candlestick charts are a primary tool for price action traders. Each candlestick represents a specific period and shows the open, high, low, and closing prices. The shape and color of the candlesticks form patterns (e.g., Doji, Hammer, Engulfing) that provide insights into market sentiment and can signal potential reversals or continuations.
Trend Analysis
Price action traders identify the market’s trend by observing the sequence of highs and lows. An uptrend is characterized by a series of higher highs and higher lows, while a downtrend is marked by lower highs and lower lows. A break in this sequence can indicate a potential trend reversal.
💰Quotes:
“Price action is the only truth on the chart.”
“Everything you need to know is written in the candles.”
“Indicators lag, price action leads.”
“Trade what you see, not what you think.”
“Every candle tells a story. Learn to read it.”
💰Quotes:
“Support and resistance are the footprints of money.”
“A closed candle is a fact, an open candle is only a possibility.”
“The market doesn’t hide; it leaves clues in price action.”
“The best trades look obvious… after you’ve learned to see them.”
“Patterns are just human emotions drawn on a chart.”
The Power of PriceAction
💰What in the Kraken’s Name is Price Action?
Imagine you’re on a bustling market street, and everyone’s shouting their prices for pineapples. You don’t need a fancy economist with a spreadsheet to tell you if pineapples are getting more popular or less. You just watch what people are doing: are they eagerly snatching them up at higher prices, or are the vendors struggling to give them away?
Price action is exactly that, but for stocks and other assets! It’s simply reading the story the market is telling you directly through the price itself. No need for complicated, lagging indicators that are always a step behind, like a tired parrot squawking old news. You’re looking at the raw, unfiltered moves on your chart – the ultimate truth of supply and demand, fear and greed.
💰Why is it the Golden Compass of Trading?
Forget trying to navigate with a half-broken sextant! Price action is your North Star, your most reliable guide:
It’s the OG (Original Gangster) Signal: Every indicator you see on a chart is derived from price. Price action is the price. It’s the source code, the main event, the real deal. When you’re looking at price action, you’re getting the news straight from the horse’s mouth, not through a dozen gossipy villagers.
No Lag, Just Action! Imagine trying to surf a wave by looking at where the last wave broke. You’d be wiped out! Many indicators are “lagging,” meaning they tell you what already happened. Price action is live, in the moment, allowing you to catch the wave as it forms. This means quicker decisions, tighter entries, and less time being swept away by unexpected currents.
Simpler Than a Coconut Cocktail: You don’t need a supercomputer or a massive collection of complex tools. A clean chart, your trusty eyeballs, and a basic understanding of candlestick patterns are often all you need. This simplicity reduces overwhelm and helps you make clear, decisive calls without second-guessing.
The Trend is Your Best Mate! Remember that wise old saying, “the trend is your friend”? Price action is the ultimate wingman for spotting that friend! It’s super easy to see if the market is clearly sailing upwards (making higher highs and higher lows), diving downwards (lower lows and lower highs), or just bobbing around in the doldrums. If the trend is clear, you know exactly which direction to point your ship. If it’s messy, price action tells you to stay ashore and enjoy a pineapple smoothie!
💰How to Read the Market’s Secret Diary (The Candlesticks!)
Each little candle on your chart is like a tiny scroll, telling you a mini-story of what happened during that time period (a minute, an hour, a day).
The Body: This is the fat part of the candle. A long green (or white) body means buyers were in control, pushing the price way up. A long red (or black) body means sellers dominated, sending the price tumbling. Think of it as a tug-of-war: who won that round?
The Wicks (or Shadows): These thin lines sticking out from the top and bottom are like antennae, showing you how far the price tried to go but got rejected. A long upper wick means buyers tried to push it high but sellers dragged it back down. A long lower wick means sellers tried to push it low but buyers bravely picked it up. These wicks often whisper secrets about exhaustion or reversals!
By watching how these candles form patterns – like a “Hammer” hitting rock bottom and bouncing back up (a sign of buyers coming to the rescue!), or an “Engulfing” pattern where one big candle swallows the previous one (a dramatic shift in power!) – you start to predict where the currents might take you next.
So, next time you’re charting your course, clear your deck, breathe in that salty air, and let the price action speak to you. It’s the most direct, most powerful, and frankly, the most fun way to understand what’s truly happening in the market and chart your way to potential success!
💰Quotes:
“Price action is the only truth on the chart.”
“Everything you need to know is written in the candles.”
“Indicators lag, price action leads.”
“Trade what you see, not what you think.”
“Every candle tells a story. Learn to read it.”
💰Quotes:
“Support and resistance are the footprints of money.”
“A closed candle is a fact, an open candle is only a possibility.”
“The market doesn’t hide; it leaves clues in price action.”
“The best trades look obvious… after you’ve learned to see them.”
“Patterns are just human emotions drawn on a chart.”
💰Quotes:
“Price action: the art of staring at candles until they confess.”
“Indicators are like rumors; price action is the witness.”
“Trading without price action is like driving blindfolded.”
“Sometimes the best trade is to just let the candle close.”
“If you can’t find the trend, step back and squint—price action is waving at you.”
💰Quotes:
“Enter the trade — then sit on your hands like a monk!”
“We don’t click and panic. We click and chill.”
“Traders who wait, get paid. Traders who fidget… donate!”
“We enter the trade, then do absolutely nothing like pros.”
“Let the market work. You’re not its boss.”
💰Quotes:
“Enter the trade — then sit on your hands like a monk!”
“We don’t click and panic. We click and chill.”
“Traders who wait, get paid. Traders who fidget… donate!”
“We enter the trade, then do absolutely nothing like pros.”
“Let the market work. You’re not its boss.”
💰Quotes:
“Enter the trade — then sit on your hands like a monk!”
“We don’t click and panic. We click and chill.”
“Traders who wait, get paid. Traders who fidget… donate!”
“We enter the trade, then do absolutely nothing like pros.”
“Let the market work. You’re not its boss.”
Add Your Heading Text Here
The Power of PriceAction
What is Price Action?!
Price action is a trading methodology that analyzes the movement of an asset’s price over time to make trading decisions. It is the foundation of technical analysis and operates on the principle that all relevant market information—including economic news, investor sentiment, and fundamental data—is already reflected in the asset’s price.
Instead of relying on lagging technical indicators, traders who use price action focus on a “naked” or clean chart. By observing historical price data, they identify patterns, trends, and key levels to predict future price direction.The core concepts of price action analysis include:Support and Resistance
These are price levels where an asset’s price has historically paused or reversed direction. A support level is a price floor where buying pressure is strong enough to prevent the price from falling further. A resistance level is a price ceiling where selling pressure is sufficient to stop the price from rising higher.
Candlestick Patterns
Candlestick charts are a primary tool for price action traders. Each candlestick represents a specific period and shows the open, high, low, and closing prices. The shape and color of the candlesticks form patterns (e.g., Doji, Hammer, Engulfing) that provide insights into market sentiment and can signal potential reversals or continuations.
Trend Analysis
Price action traders identify the market’s trend by observing the sequence of highs and lows. An uptrend is characterized by a series of higher highs and higher lows, while a downtrend is marked by lower highs and lower lows. A break in this sequence can indicate a potential trend reversal.
💰Quotes:
“Price action is the only truth on the chart.”
“Everything you need to know is written in the candles.”
“Indicators lag, price action leads.”
“Trade what you see, not what you think.”
“Every candle tells a story. Learn to read it.”
💰Quotes:
“Support and resistance are the footprints of money.”
“A closed candle is a fact, an open candle is only a possibility.”
“The market doesn’t hide; it leaves clues in price action.”
“The best trades look obvious… after you’ve learned to see them.”
“Patterns are just human emotions drawn on a chart.”
4. Stop Loss
Let’s talk about the unsung hero of our trading strategy, the silent guardian, the watchful protector: the stop-loss.
Our Love-Hate Relationship with the Stop-Loss
Here at [Your Company/Team Name, or “our trading desk”], we’ve got a profound, albeit slightly complicated, relationship with the stop-loss. Think of it like that super-responsible friend who always makes sure you don’t do anything too stupid on a wild night out. You might grumble when they pull you away from that questionable decision, but you’re eternally grateful the next morning when you’re not missing an eyebrow.
That’s our stop-loss. It’s the designated driver for our trades, preventing us from driving our accounts straight into a ditch at 100 miles an hour while screaming, “It’s just a temporary dip! It’ll come back!” (Spoiler alert: it usually doesn’t, not without taking your entire portfolio with it.)
Why We Embrace the “Slightly Painful Nudge”
Some traders, bless their optimistic hearts, view a stop-loss as a personal insult, a sign of weakness, or perhaps a tiny financial guillotine. They’d rather ride a losing trade down to zero, hoping for a miraculous turnaround, like waiting for a flat tire to reinflate itself through sheer willpower.
Not us. We’ve learned that a small, controlled loss is like a tiny paper cut compared to the gaping financial wound of a blown-up account. When our stop-loss gets hit, it’s not a defeat; it’s the market gently (or sometimes firmly) nudging us with a sticky note that says, “Hey, genius, your idea was wrong. Time to exit and rethink your life choices… or at least your next trade.”
The Unspoken Benefits of Our Stop-Loss Obsession
Sleep: Believe it or not, knowing your downside is capped lets you actually close your eyes at night without visions of red numbers dancing in your head. It’s truly revolutionary.
Sanity: Less emotional attachment to a dying trade means fewer arguments with your spouse about why you’re glued to the screen muttering about “support levels.”
Capital Preservation: This is fancy talk for “not losing all your money.” Our stop-loss is like a tiny, vigilant bodyguard for our trading capital, always ready to step in and say, “Alright, that’s enough fun for today.”
The Freedom to Be Wrong (Often!): Since we accept small losses, we’re not afraid to try new things. We know that if a trade goes sideways, our trusty stop-loss will catch us before we fall into the abyss of regret.
So, yes, we use stop-losses. Not because we’re pessimists, but because we’re realists who prefer controlled exits over catastrophic explosions. And honestly, it leaves us with more money for coffee and other vital trading supplies
💰Quotes:
“Enter the trade — then sit on your hands like a monk!”
“We don’t click and panic. We click and chill.”
“Traders who wait, get paid. Traders who fidget… donate!”
“We enter the trade, then do absolutely nothing like pros.”
“Let the market work. You’re not its boss.”
💰Normal Tone Slogans:
“Enter with a plan, then let the trade play out.”
“The work is in the setup — the result comes with patience.”
“We don’t babysit trades. We trust our edge.”
“Entry is action. Waiting is discipline.”
“After entry, emotion has no place — only patience.”
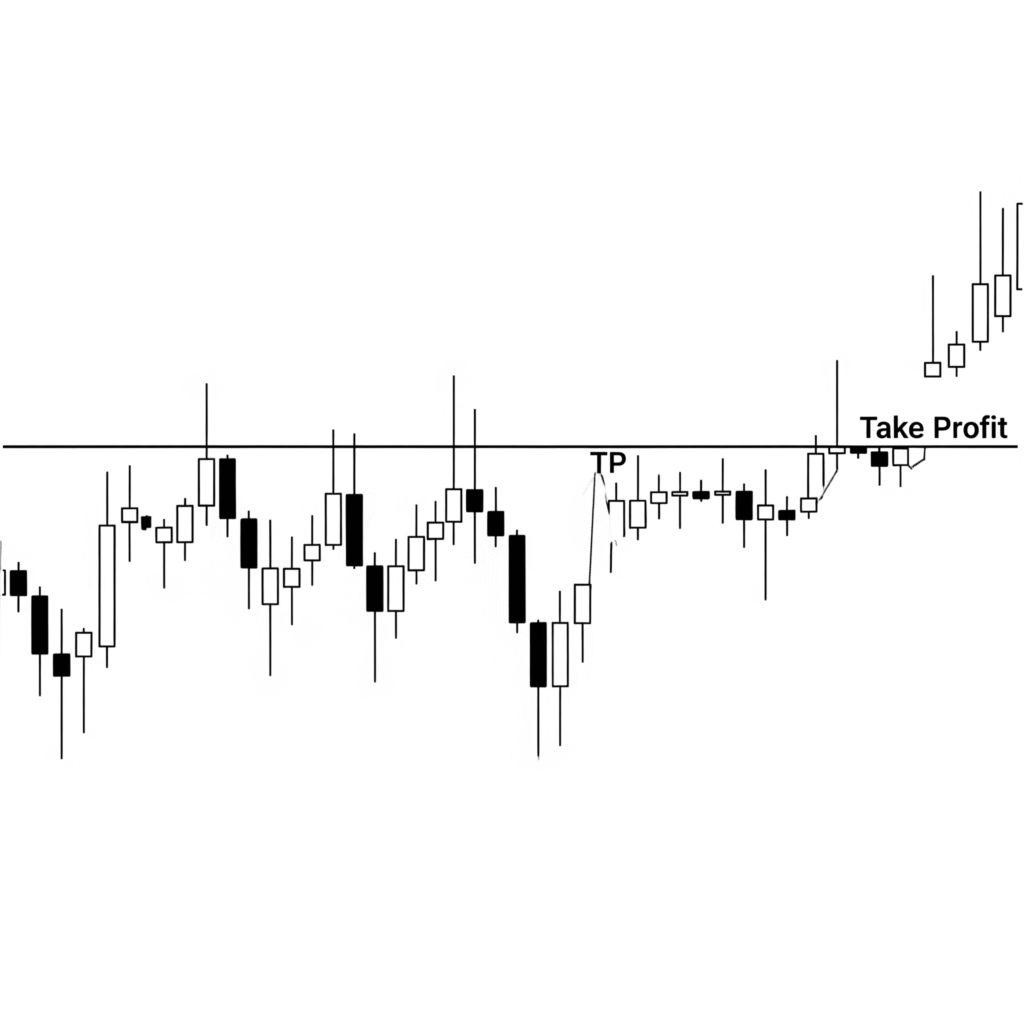
False Breaks
Alright, my audacious chart navigators! We’ve talked about the shy Inside Bar, and its slightly more mischievous cousin, the Hikkake. Now, imagine if those two decided to team up and play the ultimate market prank, a trick so sneaky, so utterly deceptive, it makes other traders stomp their feet and yell, “¡No es posible!”
Get ready for the master illusionist, the grand deceiver, the incredibly powerful, and often hilarious, False Break!
The False Break: The Market’s “Psyche! You Fell for It!” Moment!
Picture this: You’re standing outside the Sagrada Familia (it’s Monday, July 7th, 2025, and you’re feeling cultured!). The gate is firmly shut. This gate represents a key resistance level – a price point the market just can’t seem to get past. Traders have tried to push through it before, but the price just bounces off.
Suddenly, a group of really enthusiastic tourists (the “Bulls”) push! The gate creaks! It wobbles! It even appears to open just a crack! A few excited onlookers (the “Early Breakout Buyers”) gasp and surge forward, thinking they’re getting in before anyone else. They run right for that tiny gap!
But then, WHAM! The gate slams shut! It was never truly open! It just gave a little deceptive wiggle. Those “Early Breakout Buyers” are now smushed against the gate, looking utterly bewildered, their dreams of immediate entry shattered. They’re TRAPPED!
That, my friends, is a False Break!
It’s when price makes a dramatic attempt to push beyond a recognized level of support or resistance. It looks convincing! It might even stay outside for a bar or two.
But then it completely fails to hold that new territory. It curls its tail between its legs and slips right back inside the previous range, like a mischievous cat who briefly darted out the door but then thought better of it.
Why This Market Prank Is Your Golden Opportunity!
This isn’t just the market being rude; it’s providing a phenomenal signal, powered by the misery of others!
The “Trapped Tourist” Phenomenon: When price breaks out, a whole bunch of eager beavers jump in, thinking they’re catching the next big wave. When it turns out to be a false break, they’re instantly stuck in a losing position. What do trapped traders do? They panic and try to get out! If they bought the failed breakout, they sell to exit. If they sold the failed breakdown, they buy to exit.
Fueling the Opposite Move: This frantic exit activity by the trapped traders creates a powerful surge of orders in the opposite direction of the failed break! Their selling fuels your short entry; their buying fuels your long entry. It’s like the gate slamming shut pushes everyone backwards with incredible force!
Revealing True Intent: A false break powerfully confirms the strength of the original resistance or support level. The market tried to go one way, was decisively rejected, and that rejection often signals a strong move in the other direction. It’s the market saying, “Nope! Not going that way! I lied! I’m going THIS way now, with a vengeance!”
So, next time you see a price try to burst through a level like a bull in a china shop, only to retreat sheepishly back inside, don’t despair! That’s not a frustrating failure; that’s the market playing a hilarious prank on the impatient, creating a perfect springboard for your next high-probability trade. You just sit back, enjoy your espresso, and wait for those trapped tourists to fuel your ride to profit!

💰Quotes:
“Enter the trade — then sit on your hands like a monk!”
“We don’t click and panic. We click and chill.”
“Traders who wait, get paid. Traders who fidget… donate!”
“We enter the trade, then do absolutely nothing like pros.”
“Let the market work. You’re not its boss.”
💰Quotes:
“Enter the trade — then sit on your hands like a monk!”
“We don’t click and panic. We click and chill.”
“Traders who wait, get paid. Traders who fidget… donate!”
“We enter the trade, then do absolutely nothing like pros.”
“Let the market work. You’re not its boss.”
💰Quotes:
-
“Enter the trade — then sit on your hands like a monk!”
-
“We don’t click and panic. We click and chill.”
-
“Traders who wait, get paid. Traders who fidget… donate!”
-
“We enter the trade, then do absolutely nothing like pros.”
-
“Let the market work. You’re not its boss.”
9. The Power of False Break
Alright, my audacious chart navigators! We’ve talked about the shy Inside Bar, and its slightly more mischievous cousin, the Hikkake. Now, imagine if those two decided to team up and play the ultimate market prank, a trick so sneaky, so utterly deceptive, it makes other traders stomp their feet and yell, “¡No es posible!”
Get ready for the master illusionist, the grand deceiver, the incredibly powerful, and often hilarious, False Break!
The False Break: The Market’s “Psyche! You Fell for It!” Moment!
Picture this: You’re standing outside the Sagrada Familia (it’s Monday, July 7th, 2025, and you’re feeling cultured!). The gate is firmly shut. This gate represents a key resistance level – a price point the market just can’t seem to get past. Traders have tried to push through it before, but the price just bounces off.
Suddenly, a group of really enthusiastic tourists (the “Bulls”) push! The gate creaks! It wobbles! It even appears to open just a crack! A few excited onlookers (the “Early Breakout Buyers”) gasp and surge forward, thinking they’re getting in before anyone else. They run right for that tiny gap!
But then, WHAM! The gate slams shut! It was never truly open! It just gave a little deceptive wiggle. Those “Early Breakout Buyers” are now smushed against the gate, looking utterly bewildered, their dreams of immediate entry shattered. They’re TRAPPED!
That, my friends, is a False Break!
It’s when price makes a dramatic attempt to push beyond a recognized level of support or resistance. It looks convincing! It might even stay outside for a bar or two.
But then it completely fails to hold that new territory. It curls its tail between its legs and slips right back inside the previous range, like a mischievous cat who briefly darted out the door but then thought better of it.
Why This Market Prank Is Your Golden Opportunity!
This isn’t just the market being rude; it’s providing a phenomenal signal, powered by the misery of others!
The “Trapped Tourist” Phenomenon: When price breaks out, a whole bunch of eager beavers jump in, thinking they’re catching the next big wave. When it turns out to be a false break, they’re instantly stuck in a losing position. What do trapped traders do? They panic and try to get out! If they bought the failed breakout, they sell to exit. If they sold the failed breakdown, they buy to exit.
Fueling the Opposite Move: This frantic exit activity by the trapped traders creates a powerful surge of orders in the opposite direction of the failed break! Their selling fuels your short entry; their buying fuels your long entry. It’s like the gate slamming shut pushes everyone backwards with incredible force!
Revealing True Intent: A false break powerfully confirms the strength of the original resistance or support level. The market tried to go one way, was decisively rejected, and that rejection often signals a strong move in the other direction. It’s the market saying, “Nope! Not going that way! I lied! I’m going THIS way now, with a vengeance!”
So, next time you see a price try to burst through a level like a bull in a china shop, only to retreat sheepishly back inside, don’t despair! That’s not a frustrating failure; that’s the market playing a hilarious prank on the impatient, creating a perfect springboard for your next high-probability trade. You just sit back, enjoy your espresso, and wait for those trapped tourists to fuel your ride to profit!
💰Quotes:
“Enter the trade — then sit on your hands like a monk!”
“We don’t click and panic. We click and chill.”
“Traders who wait, get paid. Traders who fidget… donate!”
“We enter the trade, then do absolutely nothing like pros.”
“Let the market work. You’re not its boss.”
💰Normal Tone Slogans:
“Enter with a plan, then let the trade play out.”
“The work is in the setup — the result comes with patience.”
“We don’t babysit trades. We trust our edge.”
“Entry is action. Waiting is discipline.”
“After entry, emotion has no place — only patience.”
8. Inside Bar

Alright, future trading gurus and chart whisperers! So, you’ve decided you don’t just want to trade, you want to trade the best setups. This is like being a talent scout for market opportunities – you’re looking for the next big star, not just any old extra.
Here’s how you sift through the financial dating pool to find “the one”:
Define Your “Dream Date” (Your Best Setup):
First, get specific. Are you into the strong, silent types (clear uptrends)? The bad boys who always reverse course (reversals)? Or the ones who just bounce around a lot but never commit (range-bound)? You can’t find your soulmate if you don’t know what you’re looking for, right? Decide on your “must-haves”: does it need specific chart patterns (like a double bottom, proving it hit rock bottom and is ready to rebound), or a certain “bling” from indicators (RSI saying “I’m not that overbought yet!”)?
Pick Your Dating Apps (Market Selection):
Don’t try to swipe right on every single stock, forex pair, and crypto coin in the universe. You’ll get carpal tunnel and a headache. Stick to your preferred dating pool: Are you a Wall Street stock-jockey, a forex fiend, or perhaps a crypto connoisseur? Narrow it down to a manageable watchlist, like your top 20 potential matches.
Unleash the “Vetting Committee” (Filtering Tools & Methods):
This is where the magic (and a bit of tech wizardry) happens.
Market Scanners: These are your digital matchmakers. You tell them, “Find me stocks that just broke out of a stubborn resistance level with volume that screams ‘I’m serious!'” and they’ll spit out a list. It’s like having a dating app that only shows you people who just got a promotion and are actually looking for commitment.
Multiple Timeframes: This is checking their social media and their LinkedIn. A great setup on a 15-minute chart might be total noise on a daily. Does their short-term flirtation align with their long-term trend? You want consistency, people!
Relative Strength: Who’s outperforming their peers? This is like finding the person who’s actually thriving while everyone else is still complaining about their ex. They’ve got that “it” factor.
News & Catalysts: Sometimes, a market’s ready for a big move, but it needs a little push. An earnings report or a central bank announcement can be that dramatic “movie moment” that kicks off the action. Think of it as the market’s equivalent of a sudden, romantic gesture.
The “Elimination Round” (The Filtering Process):
The Big Picture First: Don’t get lost in the weeds. Is the entire market in a bull stampede or a bear hibernation? It’s tough to go against the tide, so figure out what kind of “weather” you’re fishing in.
Sector Spotlight: Which industries are shining, and which are trying to hide under a rock? Fish where the fish are biting!
Final Scrutiny: Now, and only now, do you look at individual charts from your filtered list. Does this specific setup tick all your boxes? Is the risk-reward ratio actually attractive, or are you just trying to force a square peg into a round hole?
By following this highly scientific (and totally not random) process, you’ll greatly improve your chances of finding those elusive, high-probability setups. Happy hunting, and may your charts always be in your favor!
💰Quotes:
“Enter the trade — then sit on your hands like a monk!”
“We don’t click and panic. We click and chill.”
“Traders who wait, get paid. Traders who fidget… donate!”
“We enter the trade, then do absolutely nothing like pros.”
“Let the market work. You’re not its boss.”
💰Normal Tone Slogans:
“Enter with a plan, then let the trade play out.”
“The work is in the setup — the result comes with patience.”
“We don’t babysit trades. We trust our edge.”
“Entry is action. Waiting is discipline.”
“After entry, emotion has no place — only patience.”
“Filtering The Markets”
Okay, here’s a short intro to key levels, keeping it concise and focused on their core meaning in trading:
In the dynamic world of financial trading, key levels are the unsung heroes of technical analysis. Think of them as crucial lines in the sand on a price chart – specific price points where an asset’s value has historically shown significant reaction. Whether acting as support (a floor preventing further falls) or resistance (a ceiling preventing further rises), these levels are where supply and demand typically battle it out. Understanding them is fundamental, as they offer traders powerful insights into potential price reversals, continuations, and strategic points for entering or exiting trades.
Inside Bar
Alright, gather ’round, aspiring market adventurers, and let’s talk about the holy grail of trading sanity, the secret sauce to not blowing up your account like an ill-fated fireworks display on the Fourth of July in Barcelona: the Risk/Reward Ratio!
Imagine you’re at a ridiculously fancy buffet (it’s Friday, July 4th, 2025, after all, and we’re feeling celebratory in sunny Barcelona!). You see two trays:
Tray A: Contains a single, slightly bruised olive. If you eat it, you get one point. But, oh no! If you don’t like it, you lose one point.
Tray B: Holds a glistening, perfectly cooked lobster tail. If you eat it, you get three glorious points! But, if it turns out to be secretly made of rubber (hey, it’s a fancy buffet, but still!), you lose one point.
Which one do you go for? If you’ve got half a brain and an appetite for success, you’re eyeing that lobster tail! Why? Because the potential deliciousness (reward) far outweighs the risk of a rubbery bite (risk)!
The Risk/Reward Ratio: Your Trading Buffet Guide!
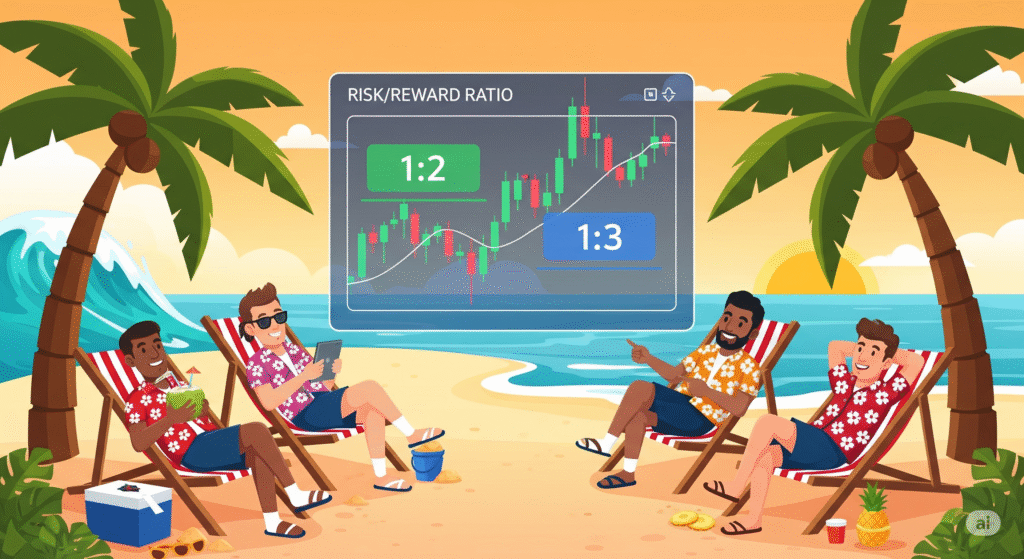
In trading, the Risk/Reward Ratio (often shortened to R:R) is simply a way to measure how much you stand to gain on a trade versus how much you stand to lose if it goes wrong.
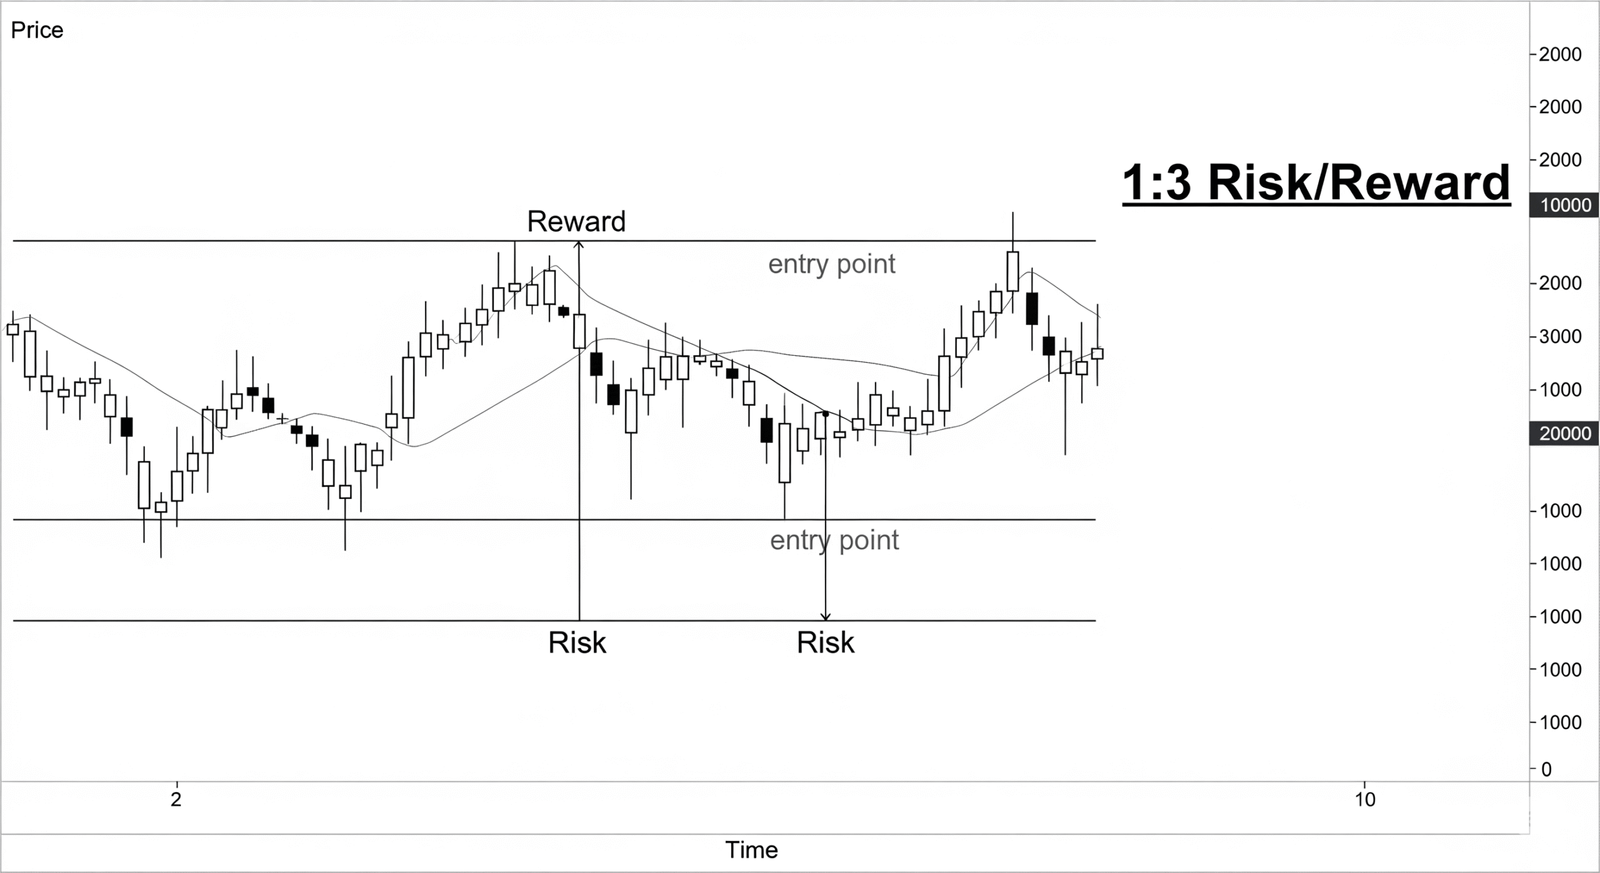
It’s expressed like this: 1:X (e.g., 1:2, 1:3, 1:5)
The “1” always represents your Risk (how much money you’re willing to lose, defined by your stop-loss).
The “X” represents your Reward (how much money you expect to gain, defined by your take-profit target).
Think of it as your Trade-Off Meter:
1:1 Ratio (The “Meh” Meal): You risk $100 to potentially make $100. It’s like flipping a coin for dinner. Not very exciting, is it? You’ve got to be right 51% of the time just to break even after commissions. BORING!
1:2 Ratio (The “Smart Snacker”): You risk $100 to potentially make $200. Now we’re talking! This means for every dollar you put on the line, you’re aiming to pull back two. Even if you’re only right 40% of the time, you can still be profitable! This is like ordering a tapas platter where even if one dish is a bit bland, the others make up for it.
1:3 Ratio (The “Feast Finder”): You risk $100 to potentially make $300. Woohoo! Now you’re getting serious! For every buck you put on the line, you’re hoping for three back. You could be wrong 60% of the time and still make money! This is like finding a Michelin-star restaurant that gives you free desserts if you don’t like the main course. Legendary!
1:5, 1:10, and Beyond (The “Whale Hunter”): These are the legendary ratios, where you’re aiming for massive payouts compared to your tiny risk. It’s like finding a whole school of tuna in the Mediterranean when you only cast a tiny net. These trades might not come often, but when they do, they can make your year!
Why is it So Crucial for Your Wallet (and Your Sanity)?
Because, my friend, you don’t have to be right all the time to be profitable! This is the ultimate mind-blower for new traders.
If you always aim for a 1:2 R:R, and you win only 40% of your trades, guess what? You’re still making money! (4 winning trades x $200 = $800; 6 losing trades x $100 = $600 loss. Net profit = $200!)
If you’re stuck aiming for 1:1, you’d need to win 55-60% just to stay afloat due to trading costs. That’s a lot more pressure!
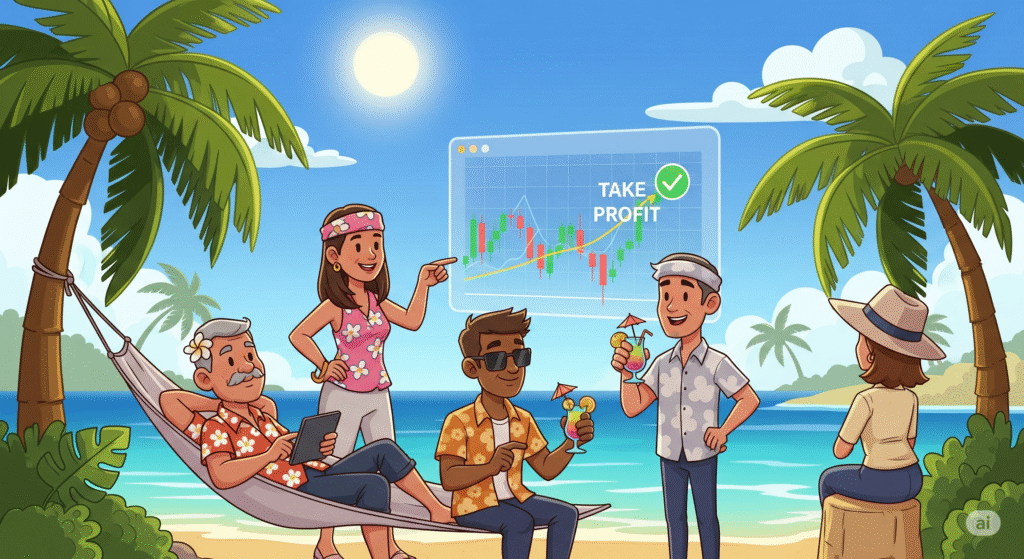
So, next time you’re eyeing a potential trade, don’t just look at the entry point. First, identify your stop-loss (your escape hatch if things go south – the risk). Then, pinpoint your take-profit (your destination for gains – the reward). Calculate that glorious ratio.
If it’s not at least 1:2 or 1:3 (depending on your strategy’s win rate), then politely decline, turn on some chill beach music, and enjoy the Barcelona sunshine. Because the best trades are like the best parties: low risk, high reward, and totally worth the wait!
💰Quotes:
“Enter the trade — then sit on your hands like a monk!”
“We don’t click and panic. We click and chill.”
“Traders who wait, get paid. Traders who fidget… donate!”
“We enter the trade, then do absolutely nothing like pros.”
“Let the market work. You’re not its boss.”
💰Normal Tone Slogans:
“Enter with a plan, then let the trade play out.”
“The work is in the setup — the result comes with patience.”
“We don’t babysit trades. We trust our edge.”
“Entry is action. Waiting is discipline.”
“After entry, emotion has no place — only patience.”
7. The Power of Hikkake
Alright, market adventurers, we’ve talked about the shy little Inside Bar – that introvert who just wants to chill within the shadow of its big Mother Bar. But what happens when that little wallflower suddenly decides to make a dramatic, deceptive move?
Get ready to meet the market’s most mischievous trickster, the stealthy ninja of candlestick patterns, the one that makes other traders scream, “Aha! Gotcha!”… only to find they are the ones who got played! Prepare yourselves for the cunning, the deceptive, the utterly brilliant power of the Hikkake Pattern!
The Hikkake: The Market’s “Got Your Nose!” Moment!
Imagine this: You’re at the bustling La Boqueria market here in Barcelona (it’s a glorious Sunday, July 6th, 2025, after all!). You see a vendor set up a stall with the most amazing, glistening jamón. Then, a smaller, more hesitant vendor sets up inside their space – that’s our Inside Bar (the little shy one).
Now, suddenly, the smaller vendor (the inside bar) makes a bold move! They stick their arm just past the big vendor’s display, enticing customers, making it look like they’re about to break out and steal all the business! Other traders (the unwary) shout, “Aha! They’re going big! Let’s follow them!” and jump in that direction.
But then, POOF! The little vendor’s arm snaps back! They didn’t really break out! They just pretended to, and now they’re back, tucked inside the Mother Bar’s range. The customers who followed them are now standing there, confused, with empty baskets. And the original big vendor just smirks.
That, my friends, is the Hikkake in action!
It starts with an Inside Bar: Our little shy candle, nestled comfortably within the previous, larger “Mother Bar.”
Then, the “Fake-Out Feather Duster”: The very next candle (the Hikkake candle) tries to break out! It’ll either make a new high (trying to go up, a bullish Hikkake) or a new low (trying to go down, a bearish Hikkake) beyond the Mother Bar’s range…
…BUT IT FAILS TO CLOSE OUTSIDE! It quickly snaps back, closing inside the Mother Bar’s range (or sometimes even closing back inside the Inside Bar’s range).
The Follow-Through: The next candle after that often takes off sharply in the opposite direction of the failed breakout attempt!
The very name “Hikkake” is Japanese for “to hook, to ensnare, to trick.” And that’s exactly what it does!
Why This Sneaky Scamp Is Your Secret Weapon!
The Hikkake isn’t just a quirky pattern; it’s a profound market psychology signal!
The Trapped Trader’s Lament: When the Hikkake happens, it means a bunch of impatient traders jumped into what looked like a breakout, only to find themselves instantly TRAPPED! If they bought the failed high, they now have a losing position. To get out, they’ll have to sell. If they sold the failed low, they’re trapped and will have to buy back.
Fuel for the Fire: These trapped traders, trying to escape their bad positions, create a surge of orders in the opposite direction of their initial mistake. This sudden rush of selling (if they were trapped buying) or buying (if they were trapped selling) becomes the rocket fuel for the Hikkake’s real move!
The Spring-Loaded Reversal/Continuation: Because the market failed to break out in one direction, it reveals underlying weakness (if it failed to go up) or strength (if it failed to go down). The Hikkake often signals a powerful reversal or a strong continuation of the original trend that the inside bar was pausing within.
So, the next time you see an Inside Bar, and then the very next candle tries to peek its head out but quickly snaps back in, don’t be fooled! That’s the Hikkake loading its slingshot. Get ready to pivot and ride the wave created by all the traders who just got tricked! It’s the market’s playful way of saying, “Gotcha! Now here’s the real direction!”
💰Quotes:
“Enter the trade — then sit on your hands like a monk!”
“We don’t click and panic. We click and chill.”
“Traders who wait, get paid. Traders who fidget… donate!”
“We enter the trade, then do absolutely nothing like pros.”
“Let the market work. You’re not its boss.”
💰Normal Tone Slogans:
“Enter with a plan, then let the trade play out.”
“The work is in the setup — the result comes with patience.”
“We don’t babysit trades. We trust our edge.”
“Entry is action. Waiting is discipline.”
“After entry, emotion has no place — only patience.”
Alright, let’s talk about the Hikkake pattern. Now, if you’re picturing some kind of exotic dance move or a fancy new sushi roll, you’re not entirely wrong on the “fancy” part, but it’s actually a sneaky little setup in the world of stock charts.
So, What in the Charting World is a Hikkake?
Imagine you’re at a party, and that one friend — you know the type — says they’re totally leaving. They grab their coat, wave goodbye, maybe even step out the door. You think, “Okay, they’re gone.” But then, just when you’ve settled back in, BAM! They’re back, usually with a mischievous grin and a new drink.
That, my friends, is essentially the Hikkake pattern in a nutshell.
In trading terms, it’s when the price of an asset looks like it’s going one way (like your friend leaving the party), but then it whips around and confidently heads in the opposite direction (your friend suddenly reappearing, ready to party even harder). The word “Hikkake” itself is Japanese and means “to trick,” “to ensnare,” or “to trap.” So, it’s literally the market playing a little prank on you.
The Anatomy of This Charting Prankster
A Hikkake isn’t just any old U-turn. It’s got specific tell-tale signs, like a bad actor trying to pull off a disguise:
The “Fake Out” Candle: First, you see a candle that closes outside the range of the previous candle. This is your friend getting up, grabbing their coat, and making a big show of saying goodbye. If it’s going up, it’s a bullish “fake out.” If it’s going down, it’s a bearish one. This candle screams, “I’m heading THIS way!”
The “Oh Wait, Never Mind” Candle(s): Then, for one or more subsequent candles, the price doesn’t follow through. Instead, it gets all wishy-washy and trades within the range of that big “fake out” candle. It’s your friend lingering at the door, checking their phone, maybe tying their shoe. They’re not committed to leaving.
The “Surprise! I’m Back!” Candle: This is the magic. The next candle breaks outside the range of the “fake out” candle, but in the opposite direction of the initial move. Your friend suddenly bursts back into the room, probably yelling, “Who’s up for karaoke?!” This is the actual signal to trade!
Why Does the Market Play Such Games?
Well, the market loves to mess with people. But in a more serious (and less funny) sense, it’s often due to:
Trapping Early Birds: Traders who jumped on the initial “fake out” move get caught off guard.
Liquidity Grabs: Big players might be deliberately pushing the price one way to trigger stop losses or attract fresh orders, only to reverse course and scoop up those positions.
Momentum Shifts: Sometimes, the initial momentum just fizzles out, and the opposite side takes control.
So, the next time you see the price pulling a disappearing act only to pop back up with a vengeance, remember the Hikkake. It’s the market’s way of winking and saying, “Gotcha!” Just try not to fall for its tricks.
💰Quotes:
“Enter the trade — then sit on your hands like a monk!”
“We don’t click and panic. We click and chill.”
“Traders who wait, get paid. Traders who fidget… donate!”
“We enter the trade, then do absolutely nothing like pros.”
“Let the market work. You’re not its boss.”
💰Normal Tone Slogans:
“Enter with a plan, then let the trade play out.”
“The work is in the setup — the result comes with patience.”
“We don’t babysit trades. We trust our edge.”
“Entry is action. Waiting is discipline.”
“After entry, emotion has no place — only patience.”
💰Hikkake Slogans:
“Hikkake: The subtle trap that reveals smart entries.”
“When the market fakes you out, Hikkake points the way.”
“Hikkake pattern: Catch the false breakout before it fades.”
“Trade the Hikkake—where patience meets precision.”
“Hikkake setups filter noise to find real moves.”
“Master the Hikkake and spot traps like a pro.”
“In deception lies opportunity — that’s the Hikkake edge.”
“The Hikkake pattern turns fakeouts into winning trades.”
💰Funny Hikkake Slogans:
“Hikkake: When the market says ‘gotcha!’ but you say ‘gotcha back!’”
“That moment when the market fakes out everyone but you — Hikkake magic!”
“Hikkake: The price action ninja move traders love to hate.”
“False break? More like ‘false scare’ with Hikkake on your side.”
“Hikkake — because the market loves a good prank.”
“Got fooled? Not if you know the Hikkake handshake.”
“Hikkake pattern: The market’s way of saying ‘just kidding!’”
“If price action had a prankster, it’d be the Hikkake.”
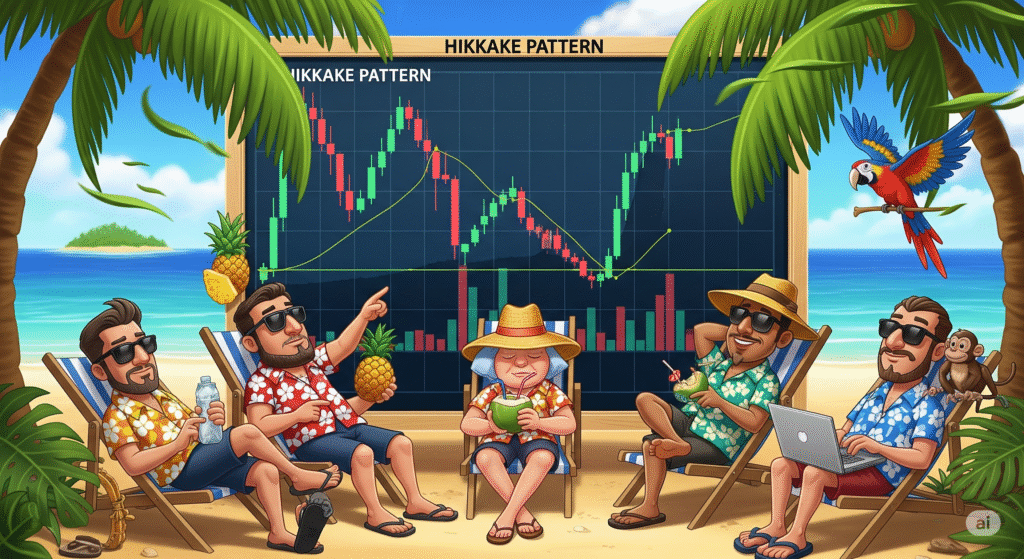
💰🧲 The Power of the Hikkake Pattern in Trading
The Hikkake pattern is a powerful and subtle price action setup that traps amateur traders and gives professionals an edge. It’s a false breakout followed by a sharp reversal — perfect for catching liquidity and entering with the smart money.

💰🔍 What is the Hikkake Pattern?
The Hikkake setup usually forms like this:
An inside bar forms (price gets tight).
Price breaks out in one direction — looks like a breakout.
But then… price reverses back inside the range.
Then it breaks out in the opposite direction — the true move.
💰⚔️ Why is it Powerful?
🎯 It traps breakout traders — those who enter too early get stopped out.
🧠 It reveals smart money behavior — institutions often cause false moves to fill orders.
🔄 It offers high-probability reversals — you enter when the amateurs are caught off guard.
💸 Great risk/reward — entries are tight, and the real move tends to be strong.
💰📌 Example Setup:
Let’s say you have:
Inside bar on daily chart.
Price breaks above the high of the inside bar — traders go long.
Price quickly reverses back down, trapping them.
You sell when the low of the inside bar is broken.
This is the Hikkake — you’re trading against the trap, with the professionals.
💰🔧 Pro Tips:
Use on higher timeframes (4H, Daily) for stronger signals.
Add confluence: trend direction, key levels, or RSI divergence.
Great for swing trading with tight stop loss and clear target.
6. Risk/Reward (rr)
Alright, gather ’round, aspiring market adventurers, and let’s talk about the holy grail of trading sanity, the secret sauce to not blowing up your account like an ill-fated fireworks display on the Fourth of July in Barcelona: the Risk/Reward Ratio!
Imagine you’re at a ridiculously fancy buffet (it’s Friday, July 4th, 2025, after all, and we’re feeling celebratory in sunny Barcelona!). You see two trays:
Tray A: Contains a single, slightly bruised olive. If you eat it, you get one point. But, oh no! If you don’t like it, you lose one point.
Tray B: Holds a glistening, perfectly cooked lobster tail. If you eat it, you get three glorious points! But, if it turns out to be secretly made of rubber (hey, it’s a fancy buffet, but still!), you lose one point.
Which one do you go for? If you’ve got half a brain and an appetite for success, you’re eyeing that lobster tail! Why? Because the potential deliciousness (reward) far outweighs the risk of a rubbery bite (risk)!
The Risk/Reward Ratio: Your Trading Buffet Guide!
In trading, the Risk/Reward Ratio (often shortened to R:R) is simply a way to measure how much you stand to gain on a trade versus how much you stand to lose if it goes wrong.
It’s expressed like this: 1:X (e.g., 1:2, 1:3, 1:5)
The “1” always represents your Risk (how much money you’re willing to lose, defined by your stop-loss).
The “X” represents your Reward (how much money you expect to gain, defined by your take-profit target).
Think of it as your Trade-Off Meter:
1:1 Ratio (The “Meh” Meal): You risk $100 to potentially make $100. It’s like flipping a coin for dinner. Not very exciting, is it? You’ve got to be right 51% of the time just to break even after commissions. BORING!
1:2 Ratio (The “Smart Snacker”): You risk $100 to potentially make $200. Now we’re talking! This means for every dollar you put on the line, you’re aiming to pull back two. Even if you’re only right 40% of the time, you can still be profitable! This is like ordering a tapas platter where even if one dish is a bit bland, the others make up for it.
1:3 Ratio (The “Feast Finder”): You risk $100 to potentially make $300. Woohoo! Now you’re getting serious! For every buck you put on the line, you’re hoping for three back. You could be wrong 60% of the time and still make money! This is like finding a Michelin-star restaurant that gives you free desserts if you don’t like the main course. Legendary!
1:5, 1:10, and Beyond (The “Whale Hunter”): These are the legendary ratios, where you’re aiming for massive payouts compared to your tiny risk. It’s like finding a whole school of tuna in the Mediterranean when you only cast a tiny net. These trades might not come often, but when they do, they can make your year!
Why is it So Crucial for Your Wallet (and Your Sanity)?
Because, my friend, you don’t have to be right all the time to be profitable! This is the ultimate mind-blower for new traders.
If you always aim for a 1:2 R:R, and you win only 40% of your trades, guess what? You’re still making money! (4 winning trades x $200 = $800; 6 losing trades x $100 = $600 loss. Net profit = $200!)
If you’re stuck aiming for 1:1, you’d need to win 55-60% just to stay afloat due to trading costs. That’s a lot more pressure!
So, next time you’re eyeing a potential trade, don’t just look at the entry point. First, identify your stop-loss (your escape hatch if things go south – the risk). Then, pinpoint your take-profit (your destination for gains – the reward). Calculate that glorious ratio.
If it’s not at least 1:2 or 1:3 (depending on your strategy’s win rate), then politely decline, turn on some chill beach music, and enjoy the Barcelona sunshine. Because the best trades are like the best parties: low risk, high reward, and totally worth the wait!
💰Quotes:
“Enter the trade — then sit on your hands like a monk!”
“We don’t click and panic. We click and chill.”
“Traders who wait, get paid. Traders who fidget… donate!”
“We enter the trade, then do absolutely nothing like pros.”
“Let the market work. You’re not its boss.”
💰Normal Tone Slogans:
“Enter with a plan, then let the trade play out.”
“The work is in the setup — the result comes with patience.”
“We don’t babysit trades. We trust our edge.”
“Entry is action. Waiting is discipline.”
“After entry, emotion has no place — only patience.”
5. Take Profit
Let’s talk about the unsung hero of our trading strategy, the silent guardian, the watchful protector: the stop-loss.
Our Love-Hate Relationship with the Stop-Loss
Here at [Your Company/Team Name, or “our trading desk”], we’ve got a profound, albeit slightly complicated, relationship with the stop-loss. Think of it like that super-responsible friend who always makes sure you don’t do anything too stupid on a wild night out. You might grumble when they pull you away from that questionable decision, but you’re eternally grateful the next morning when you’re not missing an eyebrow.
That’s our stop-loss. It’s the designated driver for our trades, preventing us from driving our accounts straight into a ditch at 100 miles an hour while screaming, “It’s just a temporary dip! It’ll come back!” (Spoiler alert: it usually doesn’t, not without taking your entire portfolio with it.)
Why We Embrace the “Slightly Painful Nudge”
Some traders, bless their optimistic hearts, view a stop-loss as a personal insult, a sign of weakness, or perhaps a tiny financial guillotine. They’d rather ride a losing trade down to zero, hoping for a miraculous turnaround, like waiting for a flat tire to reinflate itself through sheer willpower.
Not us. We’ve learned that a small, controlled loss is like a tiny paper cut compared to the gaping financial wound of a blown-up account. When our stop-loss gets hit, it’s not a defeat; it’s the market gently (or sometimes firmly) nudging us with a sticky note that says, “Hey, genius, your idea was wrong. Time to exit and rethink your life choices… or at least your next trade.”
The Unspoken Benefits of Our Stop-Loss Obsession
Sleep: Believe it or not, knowing your downside is capped lets you actually close your eyes at night without visions of red numbers dancing in your head. It’s truly revolutionary.
Sanity: Less emotional attachment to a dying trade means fewer arguments with your spouse about why you’re glued to the screen muttering about “support levels.”
Capital Preservation: This is fancy talk for “not losing all your money.” Our stop-loss is like a tiny, vigilant bodyguard for our trading capital, always ready to step in and say, “Alright, that’s enough fun for today.”
The Freedom to Be Wrong (Often!): Since we accept small losses, we’re not afraid to try new things. We know that if a trade goes sideways, our trusty stop-loss will catch us before we fall into the abyss of regret.
So, yes, we use stop-losses. Not because we’re pessimists, but because we’re realists who prefer controlled exits over catastrophic explosions. And honestly, it leaves us with more money for coffee and other vital trading supplies
💰Quotes:
“Enter the trade — then sit on your hands like a monk!”
“We don’t click and panic. We click and chill.”
“Traders who wait, get paid. Traders who fidget… donate!”
“We enter the trade, then do absolutely nothing like pros.”
“Let the market work. You’re not its boss.”
💰Normal Tone Slogans:
“Enter with a plan, then let the trade play out.”
“The work is in the setup — the result comes with patience.”
“We don’t babysit trades. We trust our edge.”
“Entry is action. Waiting is discipline.”
“After entry, emotion has no place — only patience.”
5. Take Profit
You’ve heard it whispered in the hallowed halls of finance, scrawled on bathroom stalls in trading firms, and probably even mumbled by your grandma if she’s secretly a forex guru: “The trend is your friend.”
And let me tell you, it’s not just a catchy little rhyme your mentor uses to sound smart. It’s the absolute, unadulterated truth. Because trying to trade against the trend is like trying to convince a toddler that broccoli is delicious: you’re going to lose, you’re going to get messy, and you’re going to end up crying into your pint of ice cream.
- Is the current trend bullish or bearish?
2. Is the main trend bullish or bearish on selected timeframe?
3. Where is price now? where are the keylevels?
4. Are there any Price Action?
5. Are there any failed Price Action?
6. Is there evidence that the market is getting rid of buyers or sellers?
💰
The Golden Rule: Have a Plan Before You Enter!
No matter which method you choose, the most crucial aspect of taking profit is to define your take-profit point before you enter the trade. This prevents emotional decisions and ensures you’re trading with discipline. It’s part of your “best setup” plan!
5. Take Profit
So, you’ve done it. You’ve entered a trade, the market decided to actually cooperate for once, and now your screen is glowing green like a well-watered lawn. Congratulations! This, my friends, is where the magic happens, and where many a promising trader goes horribly, hilariously wrong.
Why? Because they forget the sacred, glorious, often-ignored art of… taking profit.
The Siren Song of “Just a Little More”
You’re up 5%, then 10%, then 15%! You’re practically a financial wizard, a market whisperer, a modern-day Midas! And then that sneaky little devil on your shoulder whispers, “Just a little more. It can go higher! Imagine if it hits 20%! You’ll be rich! Rich, I tell you!”
This, dear reader, is the exact moment you need to channel your inner adult and tell that devil to shove off. Because the market, much like a fickle toddler, can turn on a dime. That beautiful green lawn can become a scorched desert faster than you can say “bear trap.”
Why “Close It” Is the Sexiest Phrase in Trading
We’ve all been there. Watching a beautiful profit evaporate, turning from vibrant green to an anemic yellow, then a sickly orange, and finally, a soul-crushing red. It’s like watching a delicious ice cream cone melt into a sticky mess on a hot day – entirely preventable, and deeply regrettable.
Here’s why taking profit isn’t just smart; it’s a profound act of self-love:
It’s Real Money: Until you hit that “close position” button, those gains are just phantom numbers on a screen. They’re like Monopoly money. Take the profit, and suddenly, it’s real money that can buy you actual things (like more trading capital, or maybe even that fancy coffee maker you’ve been eyeing).
Avoid FOMO Reversals: The fear of missing out (FOMO) is strong, but the fear of giving back profits is even stronger. Don’t let your greed turn your winning trade into a painful lesson.
Peace of Mind: Nothing beats the feeling of knowing you locked in a win. It’s like successfully parallel parking on the first try – pure, unadulterated satisfaction.
You Live to Trade Another Day: Secure those profits, and you’ve got capital for your next brilliant (or perhaps slightly less brilliant) idea. Keep chasing the last penny, and you might just blow up your account and be stuck telling “I almost made a killing” stories at family gatherings.
So, the next time your trade is glowing green, resist the urge to play financial chicken. Set your profit targets, stick to them, and when the market gives you a gift, accept it gracefully. Because remember, pigs get fat, but hogs get slaughtered. And nobody wants to be a slaughtered hog, especially when there’s profit to be taken!
💰Quotes:
“Enter the trade — then sit on your hands like a monk!”
“We don’t click and panic. We click and chill.”
“Traders who wait, get paid. Traders who fidget… donate!”
“We enter the trade, then do absolutely nothing like pros.”
“Let the market work. You’re not its boss.”
💰Normal Tone Slogans:
“Enter with a plan, then let the trade play out.”
“The work is in the setup — the result comes with patience.”
“We don’t babysit trades. We trust our edge.”
“Entry is action. Waiting is discipline.”
“After entry, emotion has no place — only patience.”
💰 What is a Take Profit?
A Take Profit (TP) is an order that automatically closes your trade when the price reaches your target profit level.
It’s the opposite of a Stop Loss — instead of limiting your loss, it locks in your profit.
💰📌 Example:
You buy EUR/USD at 1.1000 and set a
Take Profit at 1.1100
Stop Loss at 1.0950
If price goes up to 1.1100 → your position closes automatically with profit.
💰✅ Why Use a Take Profit?
💸 Secures your gains without needing to monitor the market.
🧠 Removes emotions like greed or hesitation.
📊 Follows your trading plan with risk-reward logic (e.g., 1:2).
⏱️ Efficient trading – it works even when you’re away from the screen.
💰Tips for Placing Take Profit:
Use technical levels: resistance, previous highs/lows, Fibonacci.
Follow a risk-reward ratio: e.g., if you risk 50 pips, aim for 100 pips profit.
Adjust for volatility – in fast markets, TP may need to be wider.
4. Stop Loss
Let’s talk about the unsung hero of our trading strategy, the silent guardian, the watchful protector: the stop-loss.
Our Love-Hate Relationship with the Stop-Loss
Here at [Your Company/Team Name, or “our trading desk”], we’ve got a profound, albeit slightly complicated, relationship with the stop-loss. Think of it like that super-responsible friend who always makes sure you don’t do anything too stupid on a wild night out. You might grumble when they pull you away from that questionable decision, but you’re eternally grateful the next morning when you’re not missing an eyebrow.
That’s our stop-loss. It’s the designated driver for our trades, preventing us from driving our accounts straight into a ditch at 100 miles an hour while screaming, “It’s just a temporary dip! It’ll come back!” (Spoiler alert: it usually doesn’t, not without taking your entire portfolio with it.)
Why We Embrace the “Slightly Painful Nudge”
Some traders, bless their optimistic hearts, view a stop-loss as a personal insult, a sign of weakness, or perhaps a tiny financial guillotine. They’d rather ride a losing trade down to zero, hoping for a miraculous turnaround, like waiting for a flat tire to reinflate itself through sheer willpower.
Not us. We’ve learned that a small, controlled loss is like a tiny paper cut compared to the gaping financial wound of a blown-up account. When our stop-loss gets hit, it’s not a defeat; it’s the market gently (or sometimes firmly) nudging us with a sticky note that says, “Hey, genius, your idea was wrong. Time to exit and rethink your life choices… or at least your next trade.”
The Unspoken Benefits of Our Stop-Loss Obsession
Sleep: Believe it or not, knowing your downside is capped lets you actually close your eyes at night without visions of red numbers dancing in your head. It’s truly revolutionary.
Sanity: Less emotional attachment to a dying trade means fewer arguments with your spouse about why you’re glued to the screen muttering about “support levels.”
Capital Preservation: This is fancy talk for “not losing all your money.” Our stop-loss is like a tiny, vigilant bodyguard for our trading capital, always ready to step in and say, “Alright, that’s enough fun for today.”
The Freedom to Be Wrong (Often!): Since we accept small losses, we’re not afraid to try new things. We know that if a trade goes sideways, our trusty stop-loss will catch us before we fall into the abyss of regret.
So, yes, we use stop-losses. Not because we’re pessimists, but because we’re realists who prefer controlled exits over catastrophic explosions. And honestly, it leaves us with more money for coffee and other vital trading supplies
💰Quotes:
“Enter the trade — then sit on your hands like a monk!”
“We don’t click and panic. We click and chill.”
“Traders who wait, get paid. Traders who fidget… donate!”
“We enter the trade, then do absolutely nothing like pros.”
“Let the market work. You’re not its boss.”
💰Normal Tone Slogans:
“Enter with a plan, then let the trade play out.”
“The work is in the setup — the result comes with patience.”
“We don’t babysit trades. We trust our edge.”
“Entry is action. Waiting is discipline.”
“After entry, emotion has no place — only patience.”
3. The Power of The Trend
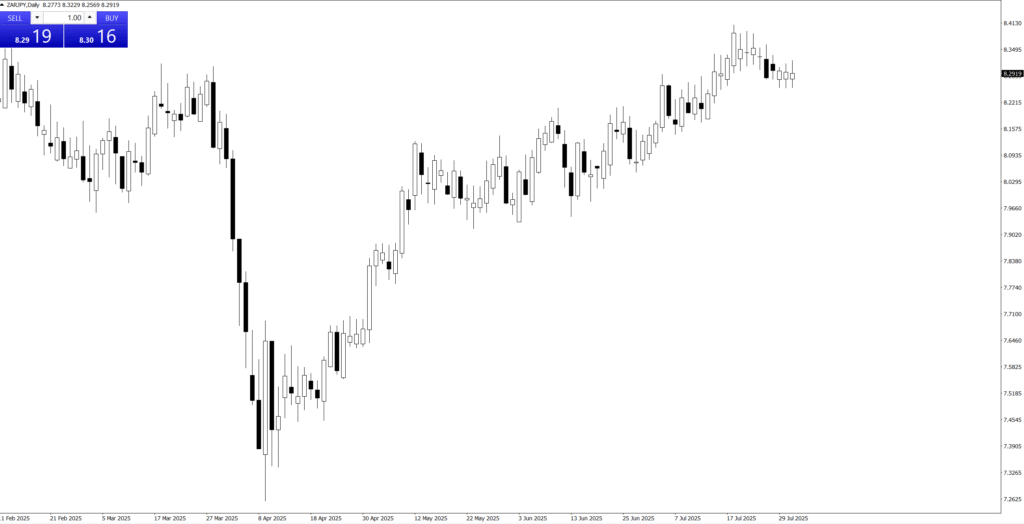
You’ve heard it whispered in the hallowed halls of finance, scrawled on bathroom stalls in trading firms, and probably even mumbled by your grandma if she’s secretly a forex guru: “The trend is your friend.”
And let me tell you, it’s not just a catchy little rhyme your mentor uses to sound smart. It’s the absolute, unadulterated truth. Because trying to trade against the trend is like trying to convince a toddler that broccoli is delicious: you’re going to lose, you’re going to get messy, and you’re going to end up crying into your pint of ice cream.
Why the Trend is Your Bestie (and the Counter-Trend is a Frenemy with Benefits)
Imagine you’re at a crowded party. The trend? That’s the cool, popular person everyone wants to hang out with. They’re effortlessly moving in one direction, and everyone’s following. Do you:
Join the popular kid and have a good time (and maybe even get some free snacks)? (That’s trend trading.)
Try to push against the flow of people, constantly bumping into elbows and getting dirty looks, all while trying to reach that one obscure corner of the room that might have a single, stale chip? (That’s counter-trend trading.)
Exactly. One sounds like a party; the other sounds like a bad day at the mall on Black Friday.
The Siren Song of the Reversal (and Why You Should Plug Your Ears)
We’ve all felt it. That little voice in your head, whispering sweet nothings like, “But it has to turn around! It’s gone too far!” That, my friends, is the siren song of the reversal, luring innocent traders onto the jagged rocks of their stop-loss orders.
Here’s the deal: Trends are like those annoying relatives who just keep talking. They might pause for breath, they might even take a sip of water, but they’re generally going to keep going in the same direction until they’ve exhausted themselves or someone physically pulls them away. Trying to pick the exact moment they’ll shut up is a fool’s errand.
So, How Do You Befriend the Trend?
It’s simple, really:
Don’t fight it: If the market’s going up, don’t short it just because you feel it’s “too high.” If it’s plummeting, don’t try to catch a falling knife unless you enjoy emergency room visits.
Ride the wave: Identify the direction the market wants to go, and then hop on for the ride. It’s like catching a bus – much easier than trying to push it uphill yourself.
Know when to get off: Even your best friend eventually leaves the party. Trends reverse. Learn to spot the signs of exhaustion, take your profits, and look for the next popular person to hang out with.
In conclusion, attempting to outsmart the trend is a recipe for tears, frustration, and probably a very unhealthy relationship with your trading platform. So, instead of being the rebellious teenager of the markets, be the smart, agreeable one. Embrace the trend. It’s your friend, your guide, and potentially, your path to less stress and more actual money.
💰Quotes:
“Enter the trade — then sit on your hands like a monk!”
“We don’t click and panic. We click and chill.”
“Traders who wait, get paid. Traders who fidget… donate!”
“We enter the trade, then do absolutely nothing like pros.”
“Let the market work. You’re not its boss.”
💰Normal Tone Slogans:
“Enter with a plan, then let the trade play out.”
“The work is in the setup — the result comes with patience.”
“We don’t babysit trades. We trust our edge.”
“Entry is action. Waiting is discipline.”
“After entry, emotion has no place — only patience.”
The Power of SwingTrading
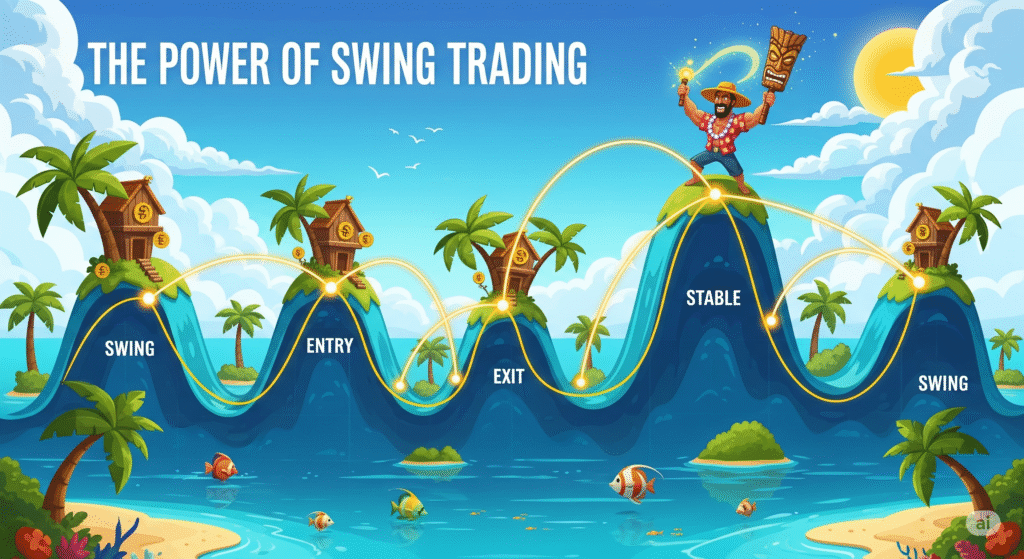
Our Exclusive Focus: Swing Trading
Why do we swing trade here? Oh, that’s easy. Because we value our sleep, our sanity, and the ability to occasionally leave our desks without the market staging an intervention.
The Day Trading Delusion (and Why We Skip It)
Some folks, bless their caffeine-fueled hearts, choose the path of day trading. They live a life of milliseconds and heart palpitations, glued to screens like a barnacle on a hull, convinced that if they blink, they’ll miss out on… well, something. Probably just another micro-fluctuation that will send their blood pressure soaring.
Here, we prefer to think of day trading as a high-stakes staring contest with a computer screen. And frankly, our eyes get tired. Plus, we’ve realized that trying to wrestle pennies from the market’s iron grip every five minutes is less like trading and more like an extreme sport designed to induce early-onset grey hair.
The “Long-Term Investor” Lament (and Why We Sidestep It)
Then you have the long-term investors. Wonderful people, truly. They buy a stock and then… wait. And wait. And then they wait some more. Sometimes they wait for years, patiently watching their portfolio fluctuate like a yo-yo on a very, very long string. They’re basically the market’s zen masters, embodying patience to an almost alarming degree.
We respect their serenity, but let’s be real: we’re not quite ready to commit to a stock for longer than some people date. We like to see our money move. Not in a frantic, day-trading “chicken with its head cut off” kind of way, but more of a “let’s ride this wave for a bit and then jump off with some profit before it crashes on the shore” kind of way.
Swing Trading: The Goldilocks Zone of Awesomeness
That’s where swing trading waltzes in, looking all sophisticated and just-right. It’s the glorious middle ground, the financial equivalent of having your cake and eating it too (without getting indigestion from frantic short-term moves or developing wrinkles from infinite waiting).
Here’s why we swing:
We like our beauty sleep: No need to set alarms for pre-market jitters or post-market analysis paralysis. We set our trades, go to bed, and let the market do its thing.
We appreciate a good life: Ever tried to enjoy a weekend when you’re terrified of a Monday morning gap? We haven’t, because our trades are designed to ride bigger moves, meaning less stress and more actual living.
We’re not greedy, just efficient: We aim for those sweet, juicy price swings – not every single tick, and not the glacial pace of a multi-year hold. Just enough to make a decent profit and move on to the next opportunity.
Our charts look less like a toddler’s scribble: With a longer timeframe, the noise calms down, and the actual trends emerge. It’s like turning down the volume on a chaotic party and suddenly hearing the good music.
So, while others are either pulling their hair out or practicing extreme patience, we’re over here, calmly catching waves, enjoying our lives, and occasionally high-fiving each other when a trade goes our way. Because that’s how we roll in the wonderful, sensible, and surprisingly fun world of swing trading.
💰Quotes:
“Enter the trade — then sit on your hands like a monk!”
“We don’t click and panic. We click and chill.”
“Traders who wait, get paid. Traders who fidget… donate!”
“We enter the trade, then do absolutely nothing like pros.”
“Let the market work. You’re not its boss.”
💰Normal Tone Slogans:
“Enter with a plan, then let the trade play out.”
“The work is in the setup — the result comes with patience.”
“We don’t babysit trades. We trust our edge.”
“Entry is action. Waiting is discipline.”
“After entry, emotion has no place — only patience.”
10. The Power of Pullback/Retrace
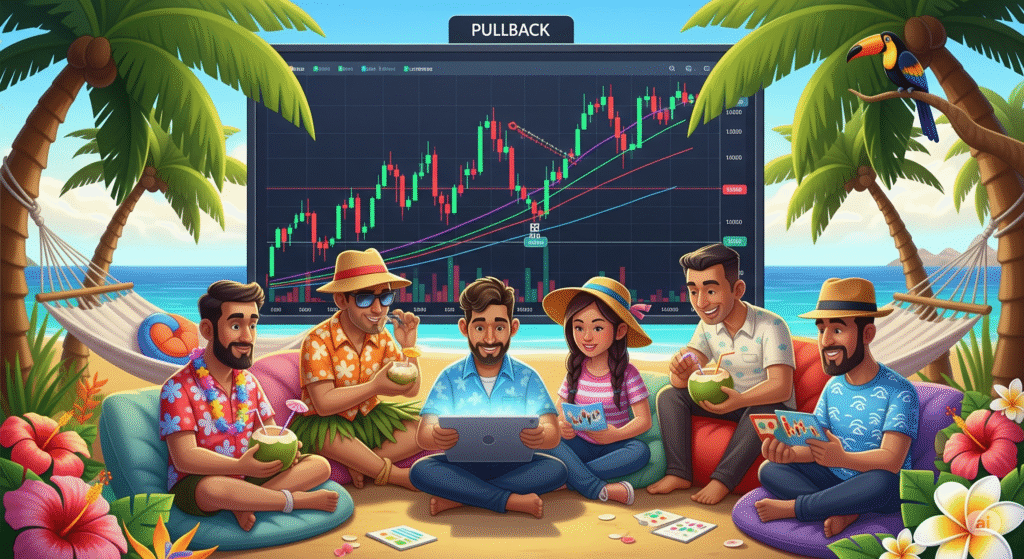
Alright, my savvy market voyagers! We’ve talked about the trend being your friend, the sneaky False Break, and even the shy but powerful Inside Bar. You’ve learned to spot when the market’s on a roll, heading straight for the profit paradise.
But what happens when your trend-friend, who was just charging ahead like a bull at a festival, suddenly decides to… take a little breather? To tie its shoelace? To check if it left the oven on?
Fear not, for this isn’t a betrayal! This is the incredibly strategic, sometimes frustrating, but ultimately glorious power of the Pullback!
The Pullback: The Market’s “Hold On, Just Gotta Grab My Sunscreen!” Moment!
Imagine this: You’re riding a magnificent, perfectly shaped wave right here off the coast of Barceloneta. You’re cruising, feeling like a surfing legend, heading straight for the shore of epic profits!
Suddenly, the wave decides to momentarily dip back a little. Just a tiny bit. It doesn’t break, it doesn’t disappear, it just sinks down a hair, giving you a quick scare. It’s like your friend, who was leading the charge to the best spot on the beach, suddenly says, “Whoops, almost forgot my towel! Be right back!”
That, my friends, is a Pullback!
Visually: It’s a temporary, counter-trend movement within a larger, established trend. If the market is in a strong uptrend (making higher highs and higher lows), a pullback is that brief, scary moment when the price dips down a bit, making a lower high or lower low for just a moment, before resuming its upward climb.
It’s the market taking a strategic pause. It’s catching its breath, shaking off the weak hands, and reloading for the next big push.
Why This Brief Dip Is Your Golden Ticket to the Best Seats!
Now, a rookie trader, fueled by FOMO (Fear Of Missing Out) and too many sangrias, sees the initial wave and jumps on it at the very top, just before the pullback. They’re like the tourist who buys the most expensive souvenir at the airport instead of waiting for the artisan market.
But you, my patient, discerning market connoisseur, you understand the secret of the Pullback!
The Discount Opportunity: A pullback is like a flash sale on your favorite trend! The price briefly comes back to a more attractive level, offering you a cheaper entry into an already established movement. Why pay full price when you can get a discount? It’s like finding a 2-for-1 deal on paella!
Shaking Off the Weak Hands: When the price dips, some nervous Nellies (traders who bought at the top) get scared and sell their positions. This brief selling pressure clears out the market, making room for fresh, confident buyers (like you!) to hop on board for the next leg up.
Confirmation of Strength: If a trend pulls back to a significant level (like a previous resistance-turned-support, or a key moving average) and then holds and resumes its original direction, it confirms that the trend is healthy and strong! It’s like your friend grabbing their towel and then sprinting even faster to the beach spot, proving they’re still in the game!
Optimal Risk/Reward: This is where your inner buffet master rejoices! By waiting for a pullback, you can often get an entry point closer to your stop-loss, giving you a much tighter risk and thus a juicier Risk/Reward ratio for the ride up! More lobster, less risk of rubber!
So, the next time your trend-friend briefly pauses, looks over its shoulder, or seems to stumble a bit, don’t panic! It’s not abandonment; it’s an invitation! It’s the market’s subtle way of saying, “Hey, wait up! I’m giving you a chance to hop on at a better price before we really take off!” It’s the moment to adjust your board, confirm your balance, and get ready for the next, even bigger, wave!
💰Quotes:
“Enter the trade — then sit on your hands like a monk!”
“We don’t click and panic. We click and chill.”
“Traders who wait, get paid. Traders who fidget… donate!”
“We enter the trade, then do absolutely nothing like pros.”
“Let the market work. You’re not its boss.”
Lorem ipsum dolor sit amet, consectetur adipiscing elit. Ut elit tellus, luctus nec ullamcorper mattis, pulvinar dapibus leo.
💰Normal Tone Slogans:
“Enter with a plan, then let the trade play out.”
“The work is in the setup — the result comes with patience.”
“We don’t babysit trades. We trust our edge.”
“Entry is action. Waiting is discipline.”
“After entry, emotion has no place — only patience.”
The Power of SwingTrading
Our Exclusive Focus: Swing Trading
Why do we swing trade here? Oh, that’s easy. Because we value our sleep, our sanity, and the ability to occasionally leave our desks without the market staging an intervention.
The Day Trading Delusion (and Why We Skip It)
Some folks, bless their caffeine-fueled hearts, choose the path of day trading. They live a life of milliseconds and heart palpitations, glued to screens like a barnacle on a hull, convinced that if they blink, they’ll miss out on… well, something. Probably just another micro-fluctuation that will send their blood pressure soaring.
Here, we prefer to think of day trading as a high-stakes staring contest with a computer screen. And frankly, our eyes get tired. Plus, we’ve realized that trying to wrestle pennies from the market’s iron grip every five minutes is less like trading and more like an extreme sport designed to induce early-onset grey hair.
The “Long-Term Investor” Lament (and Why We Sidestep It)
Then you have the long-term investors. Wonderful people, truly. They buy a stock and then… wait. And wait. And then they wait some more. Sometimes they wait for years, patiently watching their portfolio fluctuate like a yo-yo on a very, very long string. They’re basically the market’s zen masters, embodying patience to an almost alarming degree.
We respect their serenity, but let’s be real: we’re not quite ready to commit to a stock for longer than some people date. We like to see our money move. Not in a frantic, day-trading “chicken with its head cut off” kind of way, but more of a “let’s ride this wave for a bit and then jump off with some profit before it crashes on the shore” kind of way.
Swing Trading: The Goldilocks Zone of Awesomeness
That’s where swing trading waltzes in, looking all sophisticated and just-right. It’s the glorious middle ground, the financial equivalent of having your cake and eating it too (without getting indigestion from frantic short-term moves or developing wrinkles from infinite waiting).
Here’s why we swing:
We like our beauty sleep: No need to set alarms for pre-market jitters or post-market analysis paralysis. We set our trades, go to bed, and let the market do its thing.
We appreciate a good life: Ever tried to enjoy a weekend when you’re terrified of a Monday morning gap? We haven’t, because our trades are designed to ride bigger moves, meaning less stress and more actual living.
We’re not greedy, just efficient: We aim for those sweet, juicy price swings – not every single tick, and not the glacial pace of a multi-year hold. Just enough to make a decent profit and move on to the next opportunity.
Our charts look less like a toddler’s scribble: With a longer timeframe, the noise calms down, and the actual trends emerge. It’s like turning down the volume on a chaotic party and suddenly hearing the good music.
So, while others are either pulling their hair out or practicing extreme patience, we’re over here, calmly catching waves, enjoying our lives, and occasionally high-fiving each other when a trade goes our way. Because that’s how we roll in the wonderful, sensible, and surprisingly fun world of swing trading.
💰Quotes:
“Enter the trade — then sit on your hands like a monk!”
“We don’t click and panic. We click and chill.”
“Traders who wait, get paid. Traders who fidget… donate!”
“We enter the trade, then do absolutely nothing like pros.”
“Let the market work. You’re not its boss.”
💰Normal Tone Slogans:
“Enter with a plan, then let the trade play out.”
“The work is in the setup — the result comes with patience.”
“We don’t babysit trades. We trust our edge.”
“Entry is action. Waiting is discipline.”
“After entry, emotion has no place — only patience.”
10. The Power of Pullback/Retrace
Alright, my savvy market voyagers! We’ve talked about the trend being your friend, the sneaky False Break, and even the shy but powerful Inside Bar. You’ve learned to spot when the market’s on a roll, heading straight for the profit paradise.
But what happens when your trend-friend, who was just charging ahead like a bull at a festival, suddenly decides to… take a little breather? To tie its shoelace? To check if it left the oven on?
Fear not, for this isn’t a betrayal! This is the incredibly strategic, sometimes frustrating, but ultimately glorious power of the Pullback!
The Pullback: The Market’s “Hold On, Just Gotta Grab My Sunscreen!” Moment!
Imagine this: You’re riding a magnificent, perfectly shaped wave right here off the coast of Barceloneta. You’re cruising, feeling like a surfing legend, heading straight for the shore of epic profits!
Suddenly, the wave decides to momentarily dip back a little. Just a tiny bit. It doesn’t break, it doesn’t disappear, it just sinks down a hair, giving you a quick scare. It’s like your friend, who was leading the charge to the best spot on the beach, suddenly says, “Whoops, almost forgot my towel! Be right back!”
That, my friends, is a Pullback!
Visually: It’s a temporary, counter-trend movement within a larger, established trend. If the market is in a strong uptrend (making higher highs and higher lows), a pullback is that brief, scary moment when the price dips down a bit, making a lower high or lower low for just a moment, before resuming its upward climb.
It’s the market taking a strategic pause. It’s catching its breath, shaking off the weak hands, and reloading for the next big push.
Why This Brief Dip Is Your Golden Ticket to the Best Seats!
Now, a rookie trader, fueled by FOMO (Fear Of Missing Out) and too many sangrias, sees the initial wave and jumps on it at the very top, just before the pullback. They’re like the tourist who buys the most expensive souvenir at the airport instead of waiting for the artisan market.
But you, my patient, discerning market connoisseur, you understand the secret of the Pullback!
The Discount Opportunity: A pullback is like a flash sale on your favorite trend! The price briefly comes back to a more attractive level, offering you a cheaper entry into an already established movement. Why pay full price when you can get a discount? It’s like finding a 2-for-1 deal on paella!
Shaking Off the Weak Hands: When the price dips, some nervous Nellies (traders who bought at the top) get scared and sell their positions. This brief selling pressure clears out the market, making room for fresh, confident buyers (like you!) to hop on board for the next leg up.
Confirmation of Strength: If a trend pulls back to a significant level (like a previous resistance-turned-support, or a key moving average) and then holds and resumes its original direction, it confirms that the trend is healthy and strong! It’s like your friend grabbing their towel and then sprinting even faster to the beach spot, proving they’re still in the game!
Optimal Risk/Reward: This is where your inner buffet master rejoices! By waiting for a pullback, you can often get an entry point closer to your stop-loss, giving you a much tighter risk and thus a juicier Risk/Reward ratio for the ride up! More lobster, less risk of rubber!
So, the next time your trend-friend briefly pauses, looks over its shoulder, or seems to stumble a bit, don’t panic! It’s not abandonment; it’s an invitation! It’s the market’s subtle way of saying, “Hey, wait up! I’m giving you a chance to hop on at a better price before we really take off!” It’s the moment to adjust your board, confirm your balance, and get ready for the next, even bigger, wave!
💰Quotes:
“Enter the trade — then sit on your hands like a monk!”
“We don’t click and panic. We click and chill.”
“Traders who wait, get paid. Traders who fidget… donate!”
“We enter the trade, then do absolutely nothing like pros.”
“Let the market work. You’re not its boss.”
Lorem ipsum dolor sit amet, consectetur adipiscing elit. Ut elit tellus, luctus nec ullamcorper mattis, pulvinar dapibus leo.
💰Normal Tone Slogans:
“Enter with a plan, then let the trade play out.”
“The work is in the setup — the result comes with patience.”
“We don’t babysit trades. We trust our edge.”
“Entry is action. Waiting is discipline.”
“After entry, emotion has no place — only patience.”
Price Action: From Chaos to Clarity
💰What in the Kraken’s Name is Price Action?
Imagine you’re on a bustling market street, and everyone’s shouting their prices for pineapples. You don’t need a fancy economist with a spreadsheet to tell you if pineapples are getting more popular or less. You just watch what people are doing: are they eagerly snatching them up at higher prices, or are the vendors struggling to give them away?
Price action is exactly that, but for stocks and other assets! It’s simply reading the story the market is telling you directly through the price itself. No need for complicated, lagging indicators that are always a step behind, like a tired parrot squawking old news. You’re looking at the raw, unfiltered moves on your chart – the ultimate truth of supply and demand, fear and greed.
💰Why is it the Golden Compass of Trading?
Forget trying to navigate with a half-broken sextant! Price action is your North Star, your most reliable guide:
It’s the OG (Original Gangster) Signal: Every indicator you see on a chart is derived from price. Price action is the price. It’s the source code, the main event, the real deal. When you’re looking at price action, you’re getting the news straight from the horse’s mouth, not through a dozen gossipy villagers.
No Lag, Just Action! Imagine trying to surf a wave by looking at where the last wave broke. You’d be wiped out! Many indicators are “lagging,” meaning they tell you what already happened. Price action is live, in the moment, allowing you to catch the wave as it forms. This means quicker decisions, tighter entries, and less time being swept away by unexpected currents.
Simpler Than a Coconut Cocktail: You don’t need a supercomputer or a massive collection of complex tools. A clean chart, your trusty eyeballs, and a basic understanding of candlestick patterns are often all you need. This simplicity reduces overwhelm and helps you make clear, decisive calls without second-guessing.
The Trend is Your Best Mate! Remember that wise old saying, “the trend is your friend”? Price action is the ultimate wingman for spotting that friend! It’s super easy to see if the market is clearly sailing upwards (making higher highs and higher lows), diving downwards (lower lows and lower highs), or just bobbing around in the doldrums. If the trend is clear, you know exactly which direction to point your ship. If it’s messy, price action tells you to stay ashore and enjoy a pineapple smoothie!
💰How to Read the Market’s Secret Diary (The Candlesticks!)
Each little candle on your chart is like a tiny scroll, telling you a mini-story of what happened during that time period (a minute, an hour, a day).
The Body: This is the fat part of the candle. A long green (or white) body means buyers were in control, pushing the price way up. A long red (or black) body means sellers dominated, sending the price tumbling. Think of it as a tug-of-war: who won that round?
The Wicks (or Shadows): These thin lines sticking out from the top and bottom are like antennae, showing you how far the price tried to go but got rejected. A long upper wick means buyers tried to push it high but sellers dragged it back down. A long lower wick means sellers tried to push it low but buyers bravely picked it up. These wicks often whisper secrets about exhaustion or reversals!
By watching how these candles form patterns – like a “Hammer” hitting rock bottom and bouncing back up (a sign of buyers coming to the rescue!), or an “Engulfing” pattern where one big candle swallows the previous one (a dramatic shift in power!) – you start to predict where the currents might take you next.
So, next time you’re charting your course, clear your deck, breathe in that salty air, and let the price action speak to you. It’s the most direct, most powerful, and frankly, the most fun way to understand what’s truly happening in the market and chart your way to potential success!
💰Quotes:
“Enter the trade — then sit on your hands like a monk!”
“We don’t click and panic. We click and chill.”
“Traders who wait, get paid. Traders who fidget… donate!”
“We enter the trade, then do absolutely nothing like pros.”
“Let the market work. You’re not its boss.”
💰Normal Tone Slogans:
“Enter with a plan, then let the trade play out.”
“The work is in the setup — the result comes with patience.”
“We don’t babysit trades. We trust our edge.”
“Entry is action. Waiting is discipline.”
“After entry, emotion has no place — only patience.”
Price Action: From Chaos to Clarity
💰What in the Kraken’s Name is Price Action?
Imagine you’re on a bustling market street, and everyone’s shouting their prices for pineapples. You don’t need a fancy economist with a spreadsheet to tell you if pineapples are getting more popular or less. You just watch what people are doing: are they eagerly snatching them up at higher prices, or are the vendors struggling to give them away?
Price action is exactly that, but for stocks and other assets! It’s simply reading the story the market is telling you directly through the price itself. No need for complicated, lagging indicators that are always a step behind, like a tired parrot squawking old news. You’re looking at the raw, unfiltered moves on your chart – the ultimate truth of supply and demand, fear and greed.
💰Why is it the Golden Compass of Trading?
Forget trying to navigate with a half-broken sextant! Price action is your North Star, your most reliable guide:
It’s the OG (Original Gangster) Signal: Every indicator you see on a chart is derived from price. Price action is the price. It’s the source code, the main event, the real deal. When you’re looking at price action, you’re getting the news straight from the horse’s mouth, not through a dozen gossipy villagers.
No Lag, Just Action! Imagine trying to surf a wave by looking at where the last wave broke. You’d be wiped out! Many indicators are “lagging,” meaning they tell you what already happened. Price action is live, in the moment, allowing you to catch the wave as it forms. This means quicker decisions, tighter entries, and less time being swept away by unexpected currents.
Simpler Than a Coconut Cocktail: You don’t need a supercomputer or a massive collection of complex tools. A clean chart, your trusty eyeballs, and a basic understanding of candlestick patterns are often all you need. This simplicity reduces overwhelm and helps you make clear, decisive calls without second-guessing.
The Trend is Your Best Mate! Remember that wise old saying, “the trend is your friend”? Price action is the ultimate wingman for spotting that friend! It’s super easy to see if the market is clearly sailing upwards (making higher highs and higher lows), diving downwards (lower lows and lower highs), or just bobbing around in the doldrums. If the trend is clear, you know exactly which direction to point your ship. If it’s messy, price action tells you to stay ashore and enjoy a pineapple smoothie!
💰How to Read the Market’s Secret Diary (The Candlesticks!)
Each little candle on your chart is like a tiny scroll, telling you a mini-story of what happened during that time period (a minute, an hour, a day).
The Body: This is the fat part of the candle. A long green (or white) body means buyers were in control, pushing the price way up. A long red (or black) body means sellers dominated, sending the price tumbling. Think of it as a tug-of-war: who won that round?
The Wicks (or Shadows): These thin lines sticking out from the top and bottom are like antennae, showing you how far the price tried to go but got rejected. A long upper wick means buyers tried to push it high but sellers dragged it back down. A long lower wick means sellers tried to push it low but buyers bravely picked it up. These wicks often whisper secrets about exhaustion or reversals!
By watching how these candles form patterns – like a “Hammer” hitting rock bottom and bouncing back up (a sign of buyers coming to the rescue!), or an “Engulfing” pattern where one big candle swallows the previous one (a dramatic shift in power!) – you start to predict where the currents might take you next.
So, next time you’re charting your course, clear your deck, breathe in that salty air, and let the price action speak to you. It’s the most direct, most powerful, and frankly, the most fun way to understand what’s truly happening in the market and chart your way to potential success!
💰Quotes:
-
“Enter the trade — then sit on your hands like a monk!”
-
“We don’t click and panic. We click and chill.”
-
“Traders who wait, get paid. Traders who fidget… donate!”
-
“We enter the trade, then do absolutely nothing like pros.”
-
“Let the market work. You’re not its boss.”
💰Quotes:
-
“Enter the trade — then sit on your hands like a monk!”
-
“We don’t click and panic. We click and chill.”
-
“Traders who wait, get paid. Traders who fidget… donate!”
-
“We enter the trade, then do absolutely nothing like pros.”
-
“Let the market work. You’re not its boss.”
Price Action: From Chaos to Clarity
💰Quotes:
“Enter the trade — then sit on your hands like a monk!”
“We don’t click and panic. We click and chill.”
“Traders who wait, get paid. Traders who fidget… donate!”
“We enter the trade, then do absolutely nothing like pros.”
“Let the market work. You’re not its boss.”
💰Normal Tone Slogans:
“Enter with a plan, then let the trade play out.”
“The work is in the setup — the result comes with patience.”
“We don’t babysit trades. We trust our edge.”
“Entry is action. Waiting is discipline.”
“After entry, emotion has no place — only patience.”
💰How to Read the Market’s Secret Diary (The Candlesticks!)
Each little candle on your chart is like a tiny scroll, telling you a mini-story of what happened during that time period (a minute, an hour, a day).
The Body: This is the fat part of the candle. A long green (or white) body means buyers were in control, pushing the price way up. A long red (or black) body means sellers dominated, sending the price tumbling. Think of it as a tug-of-war: who won that round?
The Wicks (or Shadows): These thin lines sticking out from the top and bottom are like antennae, showing you how far the price tried to go but got rejected. A long upper wick means buyers tried to push it high but sellers dragged it back down. A long lower wick means sellers tried to push it low but buyers bravely picked it up. These wicks often whisper secrets about exhaustion or reversals!
By watching how these candles form patterns – like a “Hammer” hitting rock bottom and bouncing back up (a sign of buyers coming to the rescue!), or an “Engulfing” pattern where one big candle swallows the previous one (a dramatic shift in power!) – you start to predict where the currents might take you next.
So, next time you’re charting your course, clear your deck, breathe in that salty air, and let the price action speak to you. It’s the most direct, most powerful, and frankly, the most fun way to understand what’s truly happening in the market and chart your way to potential success!