Imagine the stock market is a giant, high-stakes game of “Where’s Waldo,” except Waldo is your life savings and he’s wearing camouflage. To find him, traders use technical indicators—mathematical doodles on a screen that supposedly tell us where the money is going.
In the world of trading, these indicators generally fall into two camps: the Lagging Indicators (the historians) and the Leading Indicators (the psychics).1
1. Lagging Indicators: The “I Told You So” Crew
Lagging indicators are like that friend who watches a movie with you and says, “I knew he was the killer!” right as the credits roll. They don’t predict the future; they confirm the past.
The king of this realm is the Moving Average (MA). Whether it’s Simple (SMA) or Exponential (EMA), these lines smooth out price data to tell you what the trend has been.2
For the math nerds, a Simple Moving Average is calculated as:
Where $P$ is the price and $n$ is the number of periods.
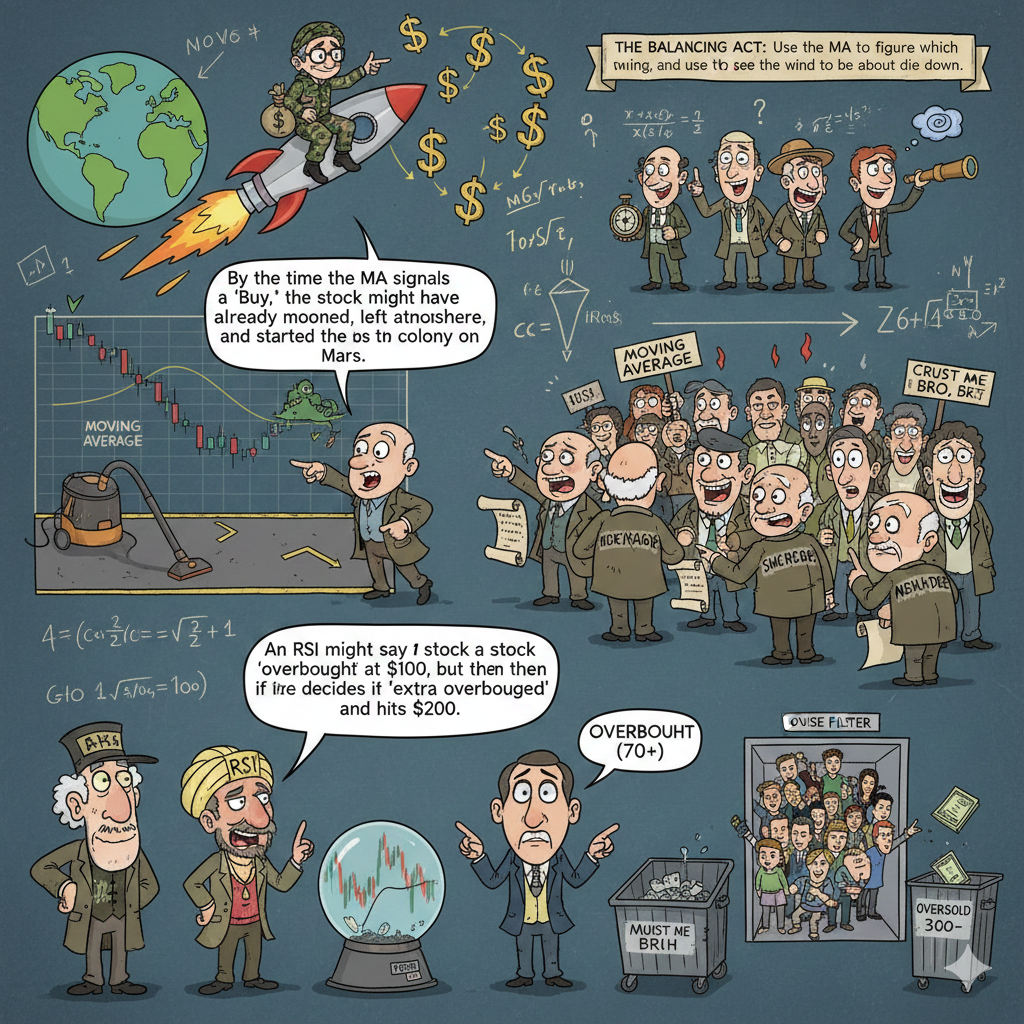
Why use them? Because prices are noisy. Without a moving average, a stock chart looks like a seismograph during a dinosaur stampede. The MA filters the noise. If the price is above the line, things are generally “good.” If it’s below, you might want to start updating your resume. The downside? By the time the MA signals a “Buy,” the stock might have already mooned, left the atmosphere, and started a colony on Mars.
2. Leading Indicators: The “Trust Me, Bro” Crew
Leading indicators are the adrenaline junkies of the charting world. They try to predict price movements before they actually happen. The most famous of these is the Relative Strength Index (RSI).
The RSI is an oscillator that travels between 0 and 100.3 It measures the speed and change of price movements.
Overbought (70+): The stock is exhausted. Everyone who wanted to buy has already bought. It’s like a crowded elevator; someone is bound to get out soon.
Oversold (30-): The stock is being dumped like a bad habit. It might be time for a bargain.
The Catch: Leading indicators are notorious for “fake-outs.” An RSI might say a stock is “overbought” at $100, but then the stock decides to be “extra overbought” and hits $200. Using RSI alone is like trying to predict when a toddler will have a meltdown—you know it’s coming, but the timing is anyone’s guess.
The Balancing Act
Using only lagging indicators means you’re always late to the party. Using only leading indicators means you’re standing in an empty parking lot waiting for a party that hasn’t started yet.
The secret sauce is using them together. Use the Moving Average to figure out which way the wind is blowing, and use the RSI to see if the wind is about to die down. It won’t make you a billionaire overnight, but it might stop you from buying at the absolute peak of a speculative bubble.
Would you like me to explain how to set up a specific “Crossover” strategy using these two indicators on a chart?