The Power of PriceAction


What is Price Action?!
Price action is a trading methodology that analyzes the movement of an asset’s price over time to make trading decisions. It is the foundation of technical analysis and operates on the principle that all relevant market information—including economic news, investor sentiment, and fundamental data—is already reflected in the asset’s price.
Instead of relying on lagging technical indicators, traders who use price action focus on a “naked” or clean chart. By observing historical price data, they identify patterns, trends, and key levels to predict future price direction.The core concepts of price action analysis include:Support and Resistance
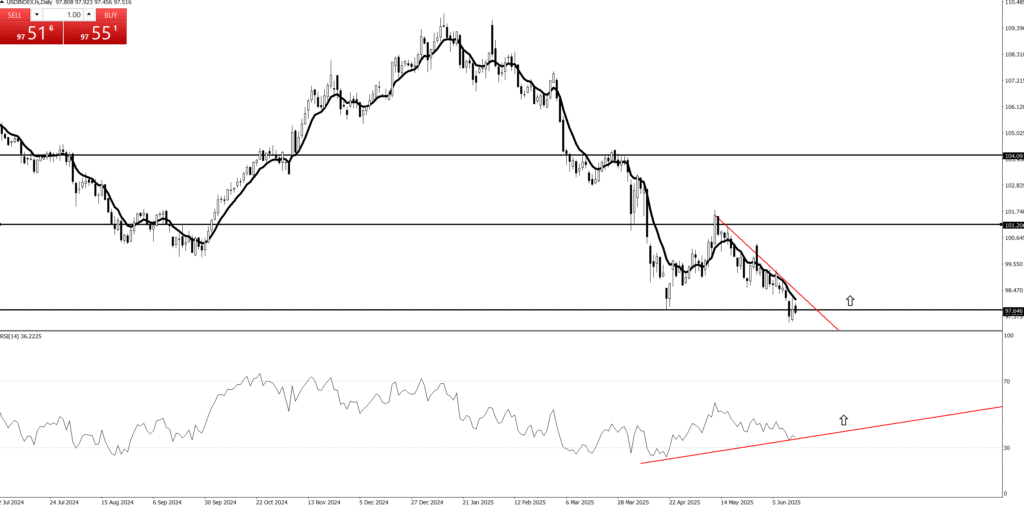
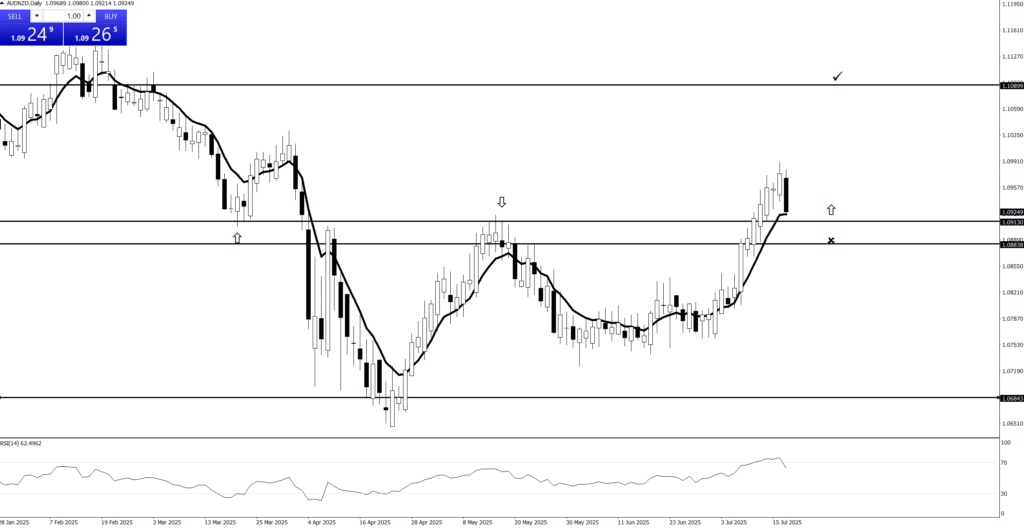
These are price levels where an asset’s price has historically paused or reversed direction. A support level is a price floor where buying pressure is strong enough to prevent the price from falling further. A resistance level is a price ceiling where selling pressure is sufficient to stop the price from rising higher.
Candlestick Patterns
Candlestick charts are a primary tool for price action traders. Each candlestick represents a specific period and shows the open, high, low, and closing prices. The shape and color of the candlesticks form patterns (e.g., Doji, Hammer, Engulfing) that provide insights into market sentiment and can signal potential reversals or continuations.
Trend Analysis
Price action traders identify the market’s trend by observing the sequence of highs and lows. An uptrend is characterized by a series of higher highs and higher lows, while a downtrend is marked by lower highs and lower lows. A break in this sequence can indicate a potential trend reversal.
The Power of KeyLevels
Key Levels: Your Chart’s VIP Section and Why It Matters!
In the messy, chaotic world of trading charts, most prices are just noise—financial clutter. But then there are the Key Levels (Support and Resistance). These aren’t just lines; they’re the battlegrounds, the turning points, and the high-stakes VIP sections of your chart where all the professional money congregates.
If you’re drawing lines based on where the price is right now, you’re doing it wrong. You need to focus on where the price has repeatedly fought and reversed!
The Psychology of the Price Magnet
Key Levels—those prices that have caused the market to reverse or pause several times—are powerful because they are entirely self-fulfilling.
Shared Memory = Shared Action: Every major bank, every hedge fund algorithm, and every professional trader sees the same key level. This consensus means that when the price approaches it, a massive, predictable wave of orders is waiting. Everyone knows a decision is coming!
The Bounce or the Break: When price hits a Key Level, one of two powerful things happens:
The Bounce (Reversal): The level holds, confirming its strength. Buyers waiting at support jump in, and the price reverses. You enter with high confidence.
The Break (Momentum): The level fails, often triggered by a cascade of stop-loss orders placed just beyond it. You enter the direction of the break, riding the massive momentum created by the forced liquidation of the masses.
The Stop-Loss Bonanza: Crucially, Key Levels act as magnets for automated orders.1 Traders place their entry limits right at the level and their stop-losses just on the other side. Trading a confirmed Key Level means you are automatically aligned to profit from the explosive momentum caused by these triggered orders.
The Professional’s Low-Risk Edge
The best advantage of Key Levels is that they offer the tightest risk control possible.
By placing your trade based on the action at the Key Level (e.g., entering long on a bounce from support), you place your Stop-Loss just below that clear boundary.2 If the market breaks the level, you’re out for a tiny, calculated loss. If it holds, you ride the move to a huge profit.
Stop cluttering your charts with unnecessary lines! Focus only on the Key Levels. They are the market’s high-probability pressure points—your ticket to predictable, exciting trading with elite risk management!
💰Quotes:
“Price action is the only truth on the chart.”
“Everything you need to know is written in the candles.”
“Indicators lag, price action leads.”
“Trade what you see, not what you think.”
“Every candle tells a story. Learn to read it.”

💰Quotes:
“Support and resistance are the footprints of money.”
“A closed candle is a fact, an open candle is only a possibility.”
“The market doesn’t hide; it leaves clues in price action.”
“The best trades look obvious… after you’ve learned to see them.”
“Patterns are just human emotions drawn on a chart.”
The Power of PriceAction
What is Price Action?!
Price action is a trading methodology that analyzes the movement of an asset’s price over time to make trading decisions. It is the foundation of technical analysis and operates on the principle that all relevant market information—including economic news, investor sentiment, and fundamental data—is already reflected in the asset’s price.
Instead of relying on lagging technical indicators, traders who use price action focus on a “naked” or clean chart. By observing historical price data, they identify patterns, trends, and key levels to predict future price direction.The core concepts of price action analysis include:Support and Resistance
These are price levels where an asset’s price has historically paused or reversed direction. A support level is a price floor where buying pressure is strong enough to prevent the price from falling further. A resistance level is a price ceiling where selling pressure is sufficient to stop the price from rising higher.
Candlestick Patterns
Candlestick charts are a primary tool for price action traders. Each candlestick represents a specific period and shows the open, high, low, and closing prices. The shape and color of the candlesticks form patterns (e.g., Doji, Hammer, Engulfing) that provide insights into market sentiment and can signal potential reversals or continuations.
Trend Analysis
Price action traders identify the market’s trend by observing the sequence of highs and lows. An uptrend is characterized by a series of higher highs and higher lows, while a downtrend is marked by lower highs and lower lows. A break in this sequence can indicate a potential trend reversal.
💰Quotes:
“Price action is the only truth on the chart.”
“Everything you need to know is written in the candles.”
“Indicators lag, price action leads.”
“Trade what you see, not what you think.”
“Every candle tells a story. Learn to read it.”
💰Quotes:
“Support and resistance are the footprints of money.”
“A closed candle is a fact, an open candle is only a possibility.”
“The market doesn’t hide; it leaves clues in price action.”
“The best trades look obvious… after you’ve learned to see them.”
“Patterns are just human emotions drawn on a chart.”
The Power of PriceAction
💰What in the Kraken’s Name is Price Action?
Imagine you’re on a bustling market street, and everyone’s shouting their prices for pineapples. You don’t need a fancy economist with a spreadsheet to tell you if pineapples are getting more popular or less. You just watch what people are doing: are they eagerly snatching them up at higher prices, or are the vendors struggling to give them away?
Price action is exactly that, but for stocks and other assets! It’s simply reading the story the market is telling you directly through the price itself. No need for complicated, lagging indicators that are always a step behind, like a tired parrot squawking old news. You’re looking at the raw, unfiltered moves on your chart – the ultimate truth of supply and demand, fear and greed.
💰Why is it the Golden Compass of Trading?
Forget trying to navigate with a half-broken sextant! Price action is your North Star, your most reliable guide:
It’s the OG (Original Gangster) Signal: Every indicator you see on a chart is derived from price. Price action is the price. It’s the source code, the main event, the real deal. When you’re looking at price action, you’re getting the news straight from the horse’s mouth, not through a dozen gossipy villagers.
No Lag, Just Action! Imagine trying to surf a wave by looking at where the last wave broke. You’d be wiped out! Many indicators are “lagging,” meaning they tell you what already happened. Price action is live, in the moment, allowing you to catch the wave as it forms. This means quicker decisions, tighter entries, and less time being swept away by unexpected currents.
Simpler Than a Coconut Cocktail: You don’t need a supercomputer or a massive collection of complex tools. A clean chart, your trusty eyeballs, and a basic understanding of candlestick patterns are often all you need. This simplicity reduces overwhelm and helps you make clear, decisive calls without second-guessing.
The Trend is Your Best Mate! Remember that wise old saying, “the trend is your friend”? Price action is the ultimate wingman for spotting that friend! It’s super easy to see if the market is clearly sailing upwards (making higher highs and higher lows), diving downwards (lower lows and lower highs), or just bobbing around in the doldrums. If the trend is clear, you know exactly which direction to point your ship. If it’s messy, price action tells you to stay ashore and enjoy a pineapple smoothie!
💰How to Read the Market’s Secret Diary (The Candlesticks!)
Each little candle on your chart is like a tiny scroll, telling you a mini-story of what happened during that time period (a minute, an hour, a day).
The Body: This is the fat part of the candle. A long green (or white) body means buyers were in control, pushing the price way up. A long red (or black) body means sellers dominated, sending the price tumbling. Think of it as a tug-of-war: who won that round?
The Wicks (or Shadows): These thin lines sticking out from the top and bottom are like antennae, showing you how far the price tried to go but got rejected. A long upper wick means buyers tried to push it high but sellers dragged it back down. A long lower wick means sellers tried to push it low but buyers bravely picked it up. These wicks often whisper secrets about exhaustion or reversals!
By watching how these candles form patterns – like a “Hammer” hitting rock bottom and bouncing back up (a sign of buyers coming to the rescue!), or an “Engulfing” pattern where one big candle swallows the previous one (a dramatic shift in power!) – you start to predict where the currents might take you next.
So, next time you’re charting your course, clear your deck, breathe in that salty air, and let the price action speak to you. It’s the most direct, most powerful, and frankly, the most fun way to understand what’s truly happening in the market and chart your way to potential success!
💰Quotes:
“Price action is the only truth on the chart.”
“Everything you need to know is written in the candles.”
“Indicators lag, price action leads.”
“Trade what you see, not what you think.”
“Every candle tells a story. Learn to read it.”
💰Quotes:
“Support and resistance are the footprints of money.”
“A closed candle is a fact, an open candle is only a possibility.”
“The market doesn’t hide; it leaves clues in price action.”
“The best trades look obvious… after you’ve learned to see them.”
“Patterns are just human emotions drawn on a chart.”
💰Quotes:
“Price action: the art of staring at candles until they confess.”
“Indicators are like rumors; price action is the witness.”
“Trading without price action is like driving blindfolded.”
“Sometimes the best trade is to just let the candle close.”
“If you can’t find the trend, step back and squint—price action is waving at you.”
💰Quotes:
“Enter the trade — then sit on your hands like a monk!”
“We don’t click and panic. We click and chill.”
“Traders who wait, get paid. Traders who fidget… donate!”
“We enter the trade, then do absolutely nothing like pros.”
“Let the market work. You’re not its boss.”
💰Quotes:
“Enter the trade — then sit on your hands like a monk!”
“We don’t click and panic. We click and chill.”
“Traders who wait, get paid. Traders who fidget… donate!”
“We enter the trade, then do absolutely nothing like pros.”
“Let the market work. You’re not its boss.”
💰Quotes:
“Enter the trade — then sit on your hands like a monk!”
“We don’t click and panic. We click and chill.”
“Traders who wait, get paid. Traders who fidget… donate!”
“We enter the trade, then do absolutely nothing like pros.”
“Let the market work. You’re not its boss.”
Add Your Heading Text Here
The Power of PriceAction
What is Price Action?!
Price action is a trading methodology that analyzes the movement of an asset’s price over time to make trading decisions. It is the foundation of technical analysis and operates on the principle that all relevant market information—including economic news, investor sentiment, and fundamental data—is already reflected in the asset’s price.
Instead of relying on lagging technical indicators, traders who use price action focus on a “naked” or clean chart. By observing historical price data, they identify patterns, trends, and key levels to predict future price direction.The core concepts of price action analysis include:Support and Resistance
These are price levels where an asset’s price has historically paused or reversed direction. A support level is a price floor where buying pressure is strong enough to prevent the price from falling further. A resistance level is a price ceiling where selling pressure is sufficient to stop the price from rising higher.
Candlestick Patterns
Candlestick charts are a primary tool for price action traders. Each candlestick represents a specific period and shows the open, high, low, and closing prices. The shape and color of the candlesticks form patterns (e.g., Doji, Hammer, Engulfing) that provide insights into market sentiment and can signal potential reversals or continuations.
Trend Analysis
Price action traders identify the market’s trend by observing the sequence of highs and lows. An uptrend is characterized by a series of higher highs and higher lows, while a downtrend is marked by lower highs and lower lows. A break in this sequence can indicate a potential trend reversal.
💰Quotes:
“Price action is the only truth on the chart.”
“Everything you need to know is written in the candles.”
“Indicators lag, price action leads.”
“Trade what you see, not what you think.”
“Every candle tells a story. Learn to read it.”
💰Quotes:
“Support and resistance are the footprints of money.”
“A closed candle is a fact, an open candle is only a possibility.”
“The market doesn’t hide; it leaves clues in price action.”
“The best trades look obvious… after you’ve learned to see them.”
“Patterns are just human emotions drawn on a chart.”
The Power of KeyLevels
Key Levels: Where the Market’s Titans Decide to Fight!
Are you drawing trendlines everywhere? Stop! Most lines on your chart are about as useful as a screen door on a submarine. If you want to trade where the big money moves, you need to focus on Key Levels (Support and Resistance). These are the legendary prices where the market has previously fought brutal, decisive battles.
Key Levels are not just numbers; they are historical declarations of intent, and they are the magnetic centers of all professional trading action!1
The Power of the Price Memory
Why are Key Levels so powerful? Because the market has a surprisingly good memory, and that memory dictates future behavior.
The Predictable Stand-Off: When price approaches a level it bounced off last month, every major algorithm and seasoned trader knows a fight is imminent. This shared recognition guarantees that a significant amount of capital is waiting there to either defend the level (causing a bounce) or overwhelm it (causing a break). You’re simply placing your bet on the outcome of a highly anticipated battle!
Order Clusters Are Gold: Key Levels are where traders naturally cluster their orders. Think of a key resistance level: short-sellers place entry orders there; current buyers place Take Profits there; and traders waiting for a breakout place their buy-stop entries just above it. This dense concentration of orders ensures that when the price hits the level, the resulting action—whether a sudden reversal or an explosive breakout—is always fast and decisive.
Risk Management Perfection: The biggest advantage is the clarity of your risk. A Key Level provides a crystal-clear boundary. If you enter a long trade on a bounce from support, you place your Stop-Loss just below that support. Your risk is tiny, defined by a price the market has already shown it respects. If the level holds, you win big; if it fails, you’re out for a small, calculated loss.
Stop chasing every tick! Focus on the Key Levels. They are the market’s high-stakes pressure points, providing predictable turning points and the best risk/reward scenarios available. Trade the levels, and you trade with the titans!
💰Quotes:
“Price action is the only truth on the chart.”
“Everything you need to know is written in the candles.”
“Indicators lag, price action leads.”
“Trade what you see, not what you think.”
“Every candle tells a story. Learn to read it.”
💰Quotes:
“Support and resistance are the footprints of money.”
“A closed candle is a fact, an open candle is only a possibility.”
“The market doesn’t hide; it leaves clues in price action.”
“The best trades look obvious… after you’ve learned to see them.”
“Patterns are just human emotions drawn on a chart.”
The Power of PriceAction
What is Price Action?!
Price action is a trading methodology that analyzes the movement of an asset’s price over time to make trading decisions. It is the foundation of technical analysis and operates on the principle that all relevant market information—including economic news, investor sentiment, and fundamental data—is already reflected in the asset’s price.
Instead of relying on lagging technical indicators, traders who use price action focus on a “naked” or clean chart. By observing historical price data, they identify patterns, trends, and key levels to predict future price direction.The core concepts of price action analysis include:Support and Resistance
These are price levels where an asset’s price has historically paused or reversed direction. A support level is a price floor where buying pressure is strong enough to prevent the price from falling further. A resistance level is a price ceiling where selling pressure is sufficient to stop the price from rising higher.
Candlestick Patterns
Candlestick charts are a primary tool for price action traders. Each candlestick represents a specific period and shows the open, high, low, and closing prices. The shape and color of the candlesticks form patterns (e.g., Doji, Hammer, Engulfing) that provide insights into market sentiment and can signal potential reversals or continuations.
Trend Analysis
Price action traders identify the market’s trend by observing the sequence of highs and lows. An uptrend is characterized by a series of higher highs and higher lows, while a downtrend is marked by lower highs and lower lows. A break in this sequence can indicate a potential trend reversal.
💰Quotes:
“Price action is the only truth on the chart.”
“Everything you need to know is written in the candles.”
“Indicators lag, price action leads.”
“Trade what you see, not what you think.”
“Every candle tells a story. Learn to read it.”
💰Quotes:
“Support and resistance are the footprints of money.”
“A closed candle is a fact, an open candle is only a possibility.”
“The market doesn’t hide; it leaves clues in price action.”
“The best trades look obvious… after you’ve learned to see them.”
“Patterns are just human emotions drawn on a chart.”
The Power of PriceAction
💰What in the Kraken’s Name is Price Action?
Imagine you’re on a bustling market street, and everyone’s shouting their prices for pineapples. You don’t need a fancy economist with a spreadsheet to tell you if pineapples are getting more popular or less. You just watch what people are doing: are they eagerly snatching them up at higher prices, or are the vendors struggling to give them away?
Price action is exactly that, but for stocks and other assets! It’s simply reading the story the market is telling you directly through the price itself. No need for complicated, lagging indicators that are always a step behind, like a tired parrot squawking old news. You’re looking at the raw, unfiltered moves on your chart – the ultimate truth of supply and demand, fear and greed.
💰Why is it the Golden Compass of Trading?
Forget trying to navigate with a half-broken sextant! Price action is your North Star, your most reliable guide:
It’s the OG (Original Gangster) Signal: Every indicator you see on a chart is derived from price. Price action is the price. It’s the source code, the main event, the real deal. When you’re looking at price action, you’re getting the news straight from the horse’s mouth, not through a dozen gossipy villagers.
No Lag, Just Action! Imagine trying to surf a wave by looking at where the last wave broke. You’d be wiped out! Many indicators are “lagging,” meaning they tell you what already happened. Price action is live, in the moment, allowing you to catch the wave as it forms. This means quicker decisions, tighter entries, and less time being swept away by unexpected currents.
Simpler Than a Coconut Cocktail: You don’t need a supercomputer or a massive collection of complex tools. A clean chart, your trusty eyeballs, and a basic understanding of candlestick patterns are often all you need. This simplicity reduces overwhelm and helps you make clear, decisive calls without second-guessing.
The Trend is Your Best Mate! Remember that wise old saying, “the trend is your friend”? Price action is the ultimate wingman for spotting that friend! It’s super easy to see if the market is clearly sailing upwards (making higher highs and higher lows), diving downwards (lower lows and lower highs), or just bobbing around in the doldrums. If the trend is clear, you know exactly which direction to point your ship. If it’s messy, price action tells you to stay ashore and enjoy a pineapple smoothie!
💰How to Read the Market’s Secret Diary (The Candlesticks!)
Each little candle on your chart is like a tiny scroll, telling you a mini-story of what happened during that time period (a minute, an hour, a day).
The Body: This is the fat part of the candle. A long green (or white) body means buyers were in control, pushing the price way up. A long red (or black) body means sellers dominated, sending the price tumbling. Think of it as a tug-of-war: who won that round?
The Wicks (or Shadows): These thin lines sticking out from the top and bottom are like antennae, showing you how far the price tried to go but got rejected. A long upper wick means buyers tried to push it high but sellers dragged it back down. A long lower wick means sellers tried to push it low but buyers bravely picked it up. These wicks often whisper secrets about exhaustion or reversals!
By watching how these candles form patterns – like a “Hammer” hitting rock bottom and bouncing back up (a sign of buyers coming to the rescue!), or an “Engulfing” pattern where one big candle swallows the previous one (a dramatic shift in power!) – you start to predict where the currents might take you next.
So, next time you’re charting your course, clear your deck, breathe in that salty air, and let the price action speak to you. It’s the most direct, most powerful, and frankly, the most fun way to understand what’s truly happening in the market and chart your way to potential success!
💰Quotes:
“Price action is the only truth on the chart.”
“Everything you need to know is written in the candles.”
“Indicators lag, price action leads.”
“Trade what you see, not what you think.”
“Every candle tells a story. Learn to read it.”
💰Quotes:
“Support and resistance are the footprints of money.”
“A closed candle is a fact, an open candle is only a possibility.”
“The market doesn’t hide; it leaves clues in price action.”
“The best trades look obvious… after you’ve learned to see them.”
“Patterns are just human emotions drawn on a chart.”
💰Quotes:
“Price action: the art of staring at candles until they confess.”
“Indicators are like rumors; price action is the witness.”
“Trading without price action is like driving blindfolded.”
“Sometimes the best trade is to just let the candle close.”
“If you can’t find the trend, step back and squint—price action is waving at you.”
💰Quotes:
“Enter the trade — then sit on your hands like a monk!”
“We don’t click and panic. We click and chill.”
“Traders who wait, get paid. Traders who fidget… donate!”
“We enter the trade, then do absolutely nothing like pros.”
“Let the market work. You’re not its boss.”
💰Quotes:
“Enter the trade — then sit on your hands like a monk!”
“We don’t click and panic. We click and chill.”
“Traders who wait, get paid. Traders who fidget… donate!”
“We enter the trade, then do absolutely nothing like pros.”
“Let the market work. You’re not its boss.”
💰Quotes:
“Enter the trade — then sit on your hands like a monk!”
“We don’t click and panic. We click and chill.”
“Traders who wait, get paid. Traders who fidget… donate!”
“We enter the trade, then do absolutely nothing like pros.”
“Let the market work. You’re not its boss.”
Add Your Heading Text Here
The Power of PriceAction
What is Price Action?!
Price action is a trading methodology that analyzes the movement of an asset’s price over time to make trading decisions. It is the foundation of technical analysis and operates on the principle that all relevant market information—including economic news, investor sentiment, and fundamental data—is already reflected in the asset’s price.
Instead of relying on lagging technical indicators, traders who use price action focus on a “naked” or clean chart. By observing historical price data, they identify patterns, trends, and key levels to predict future price direction.The core concepts of price action analysis include:Support and Resistance
These are price levels where an asset’s price has historically paused or reversed direction. A support level is a price floor where buying pressure is strong enough to prevent the price from falling further. A resistance level is a price ceiling where selling pressure is sufficient to stop the price from rising higher.
Candlestick Patterns
Candlestick charts are a primary tool for price action traders. Each candlestick represents a specific period and shows the open, high, low, and closing prices. The shape and color of the candlesticks form patterns (e.g., Doji, Hammer, Engulfing) that provide insights into market sentiment and can signal potential reversals or continuations.
Trend Analysis
Price action traders identify the market’s trend by observing the sequence of highs and lows. An uptrend is characterized by a series of higher highs and higher lows, while a downtrend is marked by lower highs and lower lows. A break in this sequence can indicate a potential trend reversal.
💰Quotes:
“Price action is the only truth on the chart.”
“Everything you need to know is written in the candles.”
“Indicators lag, price action leads.”
“Trade what you see, not what you think.”
“Every candle tells a story. Learn to read it.”
💰Quotes:
“Support and resistance are the footprints of money.”
“A closed candle is a fact, an open candle is only a possibility.”
“The market doesn’t hide; it leaves clues in price action.”
“The best trades look obvious… after you’ve learned to see them.”
“Patterns are just human emotions drawn on a chart.”
4. Stop Loss
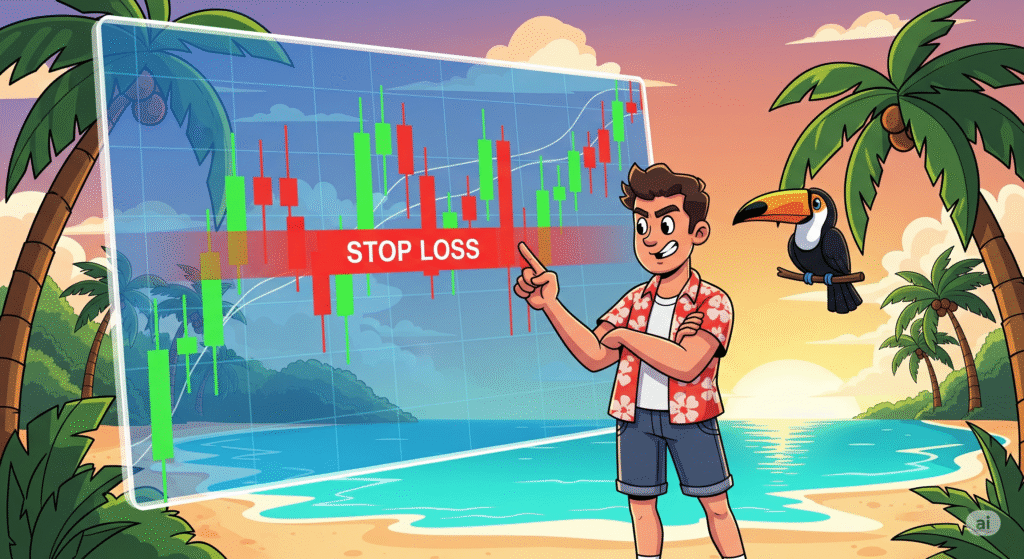
Let’s talk about the unsung hero of our trading strategy, the silent guardian, the watchful protector: the stop-loss.
Our Love-Hate Relationship with the Stop-Loss
Here at [Your Company/Team Name, or “our trading desk”], we’ve got a profound, albeit slightly complicated, relationship with the stop-loss. Think of it like that super-responsible friend who always makes sure you don’t do anything too stupid on a wild night out. You might grumble when they pull you away from that questionable decision, but you’re eternally grateful the next morning when you’re not missing an eyebrow.
That’s our stop-loss. It’s the designated driver for our trades, preventing us from driving our accounts straight into a ditch at 100 miles an hour while screaming, “It’s just a temporary dip! It’ll come back!” (Spoiler alert: it usually doesn’t, not without taking your entire portfolio with it.)
Why We Embrace the “Slightly Painful Nudge”
Some traders, bless their optimistic hearts, view a stop-loss as a personal insult, a sign of weakness, or perhaps a tiny financial guillotine. They’d rather ride a losing trade down to zero, hoping for a miraculous turnaround, like waiting for a flat tire to reinflate itself through sheer willpower.
Not us. We’ve learned that a small, controlled loss is like a tiny paper cut compared to the gaping financial wound of a blown-up account. When our stop-loss gets hit, it’s not a defeat; it’s the market gently (or sometimes firmly) nudging us with a sticky note that says, “Hey, genius, your idea was wrong. Time to exit and rethink your life choices… or at least your next trade.”
The Unspoken Benefits of Our Stop-Loss Obsession
Sleep: Believe it or not, knowing your downside is capped lets you actually close your eyes at night without visions of red numbers dancing in your head. It’s truly revolutionary.
Sanity: Less emotional attachment to a dying trade means fewer arguments with your spouse about why you’re glued to the screen muttering about “support levels.”
Capital Preservation: This is fancy talk for “not losing all your money.” Our stop-loss is like a tiny, vigilant bodyguard for our trading capital, always ready to step in and say, “Alright, that’s enough fun for today.”
The Freedom to Be Wrong (Often!): Since we accept small losses, we’re not afraid to try new things. We know that if a trade goes sideways, our trusty stop-loss will catch us before we fall into the abyss of regret.
So, yes, we use stop-losses. Not because we’re pessimists, but because we’re realists who prefer controlled exits over catastrophic explosions. And honestly, it leaves us with more money for coffee and other vital trading supplies
💰Quotes:
“Enter the trade — then sit on your hands like a monk!”
“We don’t click and panic. We click and chill.”
“Traders who wait, get paid. Traders who fidget… donate!”
“We enter the trade, then do absolutely nothing like pros.”
“Let the market work. You’re not its boss.”
💰Normal Tone Slogans:
“Enter with a plan, then let the trade play out.”
“The work is in the setup — the result comes with patience.”
“We don’t babysit trades. We trust our edge.”
“Entry is action. Waiting is discipline.”
“After entry, emotion has no place — only patience.”
Price Action: From Chaos to Clarity
💰What in the Kraken’s Name is Price Action?
Imagine you’re on a bustling market street, and everyone’s shouting their prices for pineapples. You don’t need a fancy economist with a spreadsheet to tell you if pineapples are getting more popular or less. You just watch what people are doing: are they eagerly snatching them up at higher prices, or are the vendors struggling to give them away?
Price action is exactly that, but for stocks and other assets! It’s simply reading the story the market is telling you directly through the price itself. No need for complicated, lagging indicators that are always a step behind, like a tired parrot squawking old news. You’re looking at the raw, unfiltered moves on your chart – the ultimate truth of supply and demand, fear and greed.
💰Why is it the Golden Compass of Trading?
Forget trying to navigate with a half-broken sextant! Price action is your North Star, your most reliable guide:
It’s the OG (Original Gangster) Signal: Every indicator you see on a chart is derived from price. Price action is the price. It’s the source code, the main event, the real deal. When you’re looking at price action, you’re getting the news straight from the horse’s mouth, not through a dozen gossipy villagers.
No Lag, Just Action! Imagine trying to surf a wave by looking at where the last wave broke. You’d be wiped out! Many indicators are “lagging,” meaning they tell you what already happened. Price action is live, in the moment, allowing you to catch the wave as it forms. This means quicker decisions, tighter entries, and less time being swept away by unexpected currents.
Simpler Than a Coconut Cocktail: You don’t need a supercomputer or a massive collection of complex tools. A clean chart, your trusty eyeballs, and a basic understanding of candlestick patterns are often all you need. This simplicity reduces overwhelm and helps you make clear, decisive calls without second-guessing.
The Trend is Your Best Mate! Remember that wise old saying, “the trend is your friend”? Price action is the ultimate wingman for spotting that friend! It’s super easy to see if the market is clearly sailing upwards (making higher highs and higher lows), diving downwards (lower lows and lower highs), or just bobbing around in the doldrums. If the trend is clear, you know exactly which direction to point your ship. If it’s messy, price action tells you to stay ashore and enjoy a pineapple smoothie!
💰How to Read the Market’s Secret Diary (The Candlesticks!)
Each little candle on your chart is like a tiny scroll, telling you a mini-story of what happened during that time period (a minute, an hour, a day).
The Body: This is the fat part of the candle. A long green (or white) body means buyers were in control, pushing the price way up. A long red (or black) body means sellers dominated, sending the price tumbling. Think of it as a tug-of-war: who won that round?
The Wicks (or Shadows): These thin lines sticking out from the top and bottom are like antennae, showing you how far the price tried to go but got rejected. A long upper wick means buyers tried to push it high but sellers dragged it back down. A long lower wick means sellers tried to push it low but buyers bravely picked it up. These wicks often whisper secrets about exhaustion or reversals!
By watching how these candles form patterns – like a “Hammer” hitting rock bottom and bouncing back up (a sign of buyers coming to the rescue!), or an “Engulfing” pattern where one big candle swallows the previous one (a dramatic shift in power!) – you start to predict where the currents might take you next.
So, next time you’re charting your course, clear your deck, breathe in that salty air, and let the price action speak to you. It’s the most direct, most powerful, and frankly, the most fun way to understand what’s truly happening in the market and chart your way to potential success!
💰Quotes:
“Enter the trade — then sit on your hands like a monk!”
“We don’t click and panic. We click and chill.”
“Traders who wait, get paid. Traders who fidget… donate!”
“We enter the trade, then do absolutely nothing like pros.”
“Let the market work. You’re not its boss.”
💰Normal Tone Slogans:
“Enter with a plan, then let the trade play out.”
“The work is in the setup — the result comes with patience.”
“We don’t babysit trades. We trust our edge.”
“Entry is action. Waiting is discipline.”
“After entry, emotion has no place — only patience.”
The Power of StopLoss

What is Price Action?!
Price action is a trading methodology that analyzes the movement of an asset’s price over time to make trading decisions. It is the foundation of technical analysis and operates on the principle that all relevant market information—including economic news, investor sentiment, and fundamental data—is already reflected in the asset’s price.
Instead of relying on lagging technical indicators, traders who use price action focus on a “naked” or clean chart. By observing historical price data, they identify patterns, trends, and key levels to predict future price direction.The core concepts of price action analysis include:Support and Resistance
These are price levels where an asset’s price has historically paused or reversed direction. A support level is a price floor where buying pressure is strong enough to prevent the price from falling further. A resistance level is a price ceiling where selling pressure is sufficient to stop the price from rising higher.
Candlestick Patterns
Candlestick charts are a primary tool for price action traders. Each candlestick represents a specific period and shows the open, high, low, and closing prices. The shape and color of the candlesticks form patterns (e.g., Doji, Hammer, Engulfing) that provide insights into market sentiment and can signal potential reversals or continuations.
Trend Analysis
Price action traders identify the market’s trend by observing the sequence of highs and lows. An uptrend is characterized by a series of higher highs and higher lows, while a downtrend is marked by lower highs and lower lows. A break in this sequence can indicate a potential trend reversal.
💰Quotes:
“Price action is the only truth on the chart.”
“Everything you need to know is written in the candles.”
“Indicators lag, price action leads.”
“Trade what you see, not what you think.”
“Every candle tells a story. Learn to read it.”
💰Quotes:
“Support and resistance are the footprints of money.”
“A closed candle is a fact, an open candle is only a possibility.”
“The market doesn’t hide; it leaves clues in price action.”
“The best trades look obvious… after you’ve learned to see them.”
“Patterns are just human emotions drawn on a chart.”
4. Stop Loss
Let’s talk about the unsung hero of our trading strategy, the silent guardian, the watchful protector: the stop-loss.
Our Love-Hate Relationship with the Stop-Loss
Here at [Your Company/Team Name, or “our trading desk”], we’ve got a profound, albeit slightly complicated, relationship with the stop-loss. Think of it like that super-responsible friend who always makes sure you don’t do anything too stupid on a wild night out. You might grumble when they pull you away from that questionable decision, but you’re eternally grateful the next morning when you’re not missing an eyebrow.
That’s our stop-loss. It’s the designated driver for our trades, preventing us from driving our accounts straight into a ditch at 100 miles an hour while screaming, “It’s just a temporary dip! It’ll come back!” (Spoiler alert: it usually doesn’t, not without taking your entire portfolio with it.)
Why We Embrace the “Slightly Painful Nudge”
Some traders, bless their optimistic hearts, view a stop-loss as a personal insult, a sign of weakness, or perhaps a tiny financial guillotine. They’d rather ride a losing trade down to zero, hoping for a miraculous turnaround, like waiting for a flat tire to reinflate itself through sheer willpower.
Not us. We’ve learned that a small, controlled loss is like a tiny paper cut compared to the gaping financial wound of a blown-up account. When our stop-loss gets hit, it’s not a defeat; it’s the market gently (or sometimes firmly) nudging us with a sticky note that says, “Hey, genius, your idea was wrong. Time to exit and rethink your life choices… or at least your next trade.”
The Unspoken Benefits of Our Stop-Loss Obsession
Sleep: Believe it or not, knowing your downside is capped lets you actually close your eyes at night without visions of red numbers dancing in your head. It’s truly revolutionary.
Sanity: Less emotional attachment to a dying trade means fewer arguments with your spouse about why you’re glued to the screen muttering about “support levels.”
Capital Preservation: This is fancy talk for “not losing all your money.” Our stop-loss is like a tiny, vigilant bodyguard for our trading capital, always ready to step in and say, “Alright, that’s enough fun for today.”
The Freedom to Be Wrong (Often!): Since we accept small losses, we’re not afraid to try new things. We know that if a trade goes sideways, our trusty stop-loss will catch us before we fall into the abyss of regret.
So, yes, we use stop-losses. Not because we’re pessimists, but because we’re realists who prefer controlled exits over catastrophic explosions. And honestly, it leaves us with more money for coffee and other vital trading supplies
💰Quotes:
“Enter the trade — then sit on your hands like a monk!”
“We don’t click and panic. We click and chill.”
“Traders who wait, get paid. Traders who fidget… donate!”
“We enter the trade, then do absolutely nothing like pros.”
“Let the market work. You’re not its boss.”
💰Normal Tone Slogans:
“Enter with a plan, then let the trade play out.”
“The work is in the setup — the result comes with patience.”
“We don’t babysit trades. We trust our edge.”
“Entry is action. Waiting is discipline.”
“After entry, emotion has no place — only patience.”
The Power of PriceAction
What is Price Action?!
Price action is a trading methodology that analyzes the movement of an asset’s price over time to make trading decisions. It is the foundation of technical analysis and operates on the principle that all relevant market information—including economic news, investor sentiment, and fundamental data—is already reflected in the asset’s price.
Instead of relying on lagging technical indicators, traders who use price action focus on a “naked” or clean chart. By observing historical price data, they identify patterns, trends, and key levels to predict future price direction.The core concepts of price action analysis include:Support and Resistance
These are price levels where an asset’s price has historically paused or reversed direction. A support level is a price floor where buying pressure is strong enough to prevent the price from falling further. A resistance level is a price ceiling where selling pressure is sufficient to stop the price from rising higher.
Candlestick Patterns
Candlestick charts are a primary tool for price action traders. Each candlestick represents a specific period and shows the open, high, low, and closing prices. The shape and color of the candlesticks form patterns (e.g., Doji, Hammer, Engulfing) that provide insights into market sentiment and can signal potential reversals or continuations.
Trend Analysis
Price action traders identify the market’s trend by observing the sequence of highs and lows. An uptrend is characterized by a series of higher highs and higher lows, while a downtrend is marked by lower highs and lower lows. A break in this sequence can indicate a potential trend reversal.
💰Quotes:
“Price action is the only truth on the chart.”
“Everything you need to know is written in the candles.”
“Indicators lag, price action leads.”
“Trade what you see, not what you think.”
“Every candle tells a story. Learn to read it.”
💰Quotes:
“Support and resistance are the footprints of money.”
“A closed candle is a fact, an open candle is only a possibility.”
“The market doesn’t hide; it leaves clues in price action.”
“The best trades look obvious… after you’ve learned to see them.”
“Patterns are just human emotions drawn on a chart.”
The Power of PriceAction
💰What in the Kraken’s Name is Price Action?
Imagine you’re on a bustling market street, and everyone’s shouting their prices for pineapples. You don’t need a fancy economist with a spreadsheet to tell you if pineapples are getting more popular or less. You just watch what people are doing: are they eagerly snatching them up at higher prices, or are the vendors struggling to give them away?
Price action is exactly that, but for stocks and other assets! It’s simply reading the story the market is telling you directly through the price itself. No need for complicated, lagging indicators that are always a step behind, like a tired parrot squawking old news. You’re looking at the raw, unfiltered moves on your chart – the ultimate truth of supply and demand, fear and greed.
💰Why is it the Golden Compass of Trading?
Forget trying to navigate with a half-broken sextant! Price action is your North Star, your most reliable guide:
It’s the OG (Original Gangster) Signal: Every indicator you see on a chart is derived from price. Price action is the price. It’s the source code, the main event, the real deal. When you’re looking at price action, you’re getting the news straight from the horse’s mouth, not through a dozen gossipy villagers.
No Lag, Just Action! Imagine trying to surf a wave by looking at where the last wave broke. You’d be wiped out! Many indicators are “lagging,” meaning they tell you what already happened. Price action is live, in the moment, allowing you to catch the wave as it forms. This means quicker decisions, tighter entries, and less time being swept away by unexpected currents.
Simpler Than a Coconut Cocktail: You don’t need a supercomputer or a massive collection of complex tools. A clean chart, your trusty eyeballs, and a basic understanding of candlestick patterns are often all you need. This simplicity reduces overwhelm and helps you make clear, decisive calls without second-guessing.
The Trend is Your Best Mate! Remember that wise old saying, “the trend is your friend”? Price action is the ultimate wingman for spotting that friend! It’s super easy to see if the market is clearly sailing upwards (making higher highs and higher lows), diving downwards (lower lows and lower highs), or just bobbing around in the doldrums. If the trend is clear, you know exactly which direction to point your ship. If it’s messy, price action tells you to stay ashore and enjoy a pineapple smoothie!
💰How to Read the Market’s Secret Diary (The Candlesticks!)
Each little candle on your chart is like a tiny scroll, telling you a mini-story of what happened during that time period (a minute, an hour, a day).
The Body: This is the fat part of the candle. A long green (or white) body means buyers were in control, pushing the price way up. A long red (or black) body means sellers dominated, sending the price tumbling. Think of it as a tug-of-war: who won that round?
The Wicks (or Shadows): These thin lines sticking out from the top and bottom are like antennae, showing you how far the price tried to go but got rejected. A long upper wick means buyers tried to push it high but sellers dragged it back down. A long lower wick means sellers tried to push it low but buyers bravely picked it up. These wicks often whisper secrets about exhaustion or reversals!
By watching how these candles form patterns – like a “Hammer” hitting rock bottom and bouncing back up (a sign of buyers coming to the rescue!), or an “Engulfing” pattern where one big candle swallows the previous one (a dramatic shift in power!) – you start to predict where the currents might take you next.
So, next time you’re charting your course, clear your deck, breathe in that salty air, and let the price action speak to you. It’s the most direct, most powerful, and frankly, the most fun way to understand what’s truly happening in the market and chart your way to potential success!
💰Quotes:
“Price action is the only truth on the chart.”
“Everything you need to know is written in the candles.”
“Indicators lag, price action leads.”
“Trade what you see, not what you think.”
“Every candle tells a story. Learn to read it.”
💰Quotes:
“Support and resistance are the footprints of money.”
“A closed candle is a fact, an open candle is only a possibility.”
“The market doesn’t hide; it leaves clues in price action.”
“The best trades look obvious… after you’ve learned to see them.”
“Patterns are just human emotions drawn on a chart.”
💰Quotes:
“Price action: the art of staring at candles until they confess.”
“Indicators are like rumors; price action is the witness.”
“Trading without price action is like driving blindfolded.”
“Sometimes the best trade is to just let the candle close.”
“If you can’t find the trend, step back and squint—price action is waving at you.”
💰Quotes:
“Enter the trade — then sit on your hands like a monk!”
“We don’t click and panic. We click and chill.”
“Traders who wait, get paid. Traders who fidget… donate!”
“We enter the trade, then do absolutely nothing like pros.”
“Let the market work. You’re not its boss.”
💰Quotes:
“Enter the trade — then sit on your hands like a monk!”
“We don’t click and panic. We click and chill.”
“Traders who wait, get paid. Traders who fidget… donate!”
“We enter the trade, then do absolutely nothing like pros.”
“Let the market work. You’re not its boss.”
💰Quotes:
“Enter the trade — then sit on your hands like a monk!”
“We don’t click and panic. We click and chill.”
“Traders who wait, get paid. Traders who fidget… donate!”
“We enter the trade, then do absolutely nothing like pros.”
“Let the market work. You’re not its boss.”
Add Your Heading Text Here
The Power of PriceAction
What is Price Action?!
Price action is a trading methodology that analyzes the movement of an asset’s price over time to make trading decisions. It is the foundation of technical analysis and operates on the principle that all relevant market information—including economic news, investor sentiment, and fundamental data—is already reflected in the asset’s price.
Instead of relying on lagging technical indicators, traders who use price action focus on a “naked” or clean chart. By observing historical price data, they identify patterns, trends, and key levels to predict future price direction.The core concepts of price action analysis include:Support and Resistance
These are price levels where an asset’s price has historically paused or reversed direction. A support level is a price floor where buying pressure is strong enough to prevent the price from falling further. A resistance level is a price ceiling where selling pressure is sufficient to stop the price from rising higher.
Candlestick Patterns
Candlestick charts are a primary tool for price action traders. Each candlestick represents a specific period and shows the open, high, low, and closing prices. The shape and color of the candlesticks form patterns (e.g., Doji, Hammer, Engulfing) that provide insights into market sentiment and can signal potential reversals or continuations.
Trend Analysis
Price action traders identify the market’s trend by observing the sequence of highs and lows. An uptrend is characterized by a series of higher highs and higher lows, while a downtrend is marked by lower highs and lower lows. A break in this sequence can indicate a potential trend reversal.
💰Quotes:
“Price action is the only truth on the chart.”
“Everything you need to know is written in the candles.”
“Indicators lag, price action leads.”
“Trade what you see, not what you think.”
“Every candle tells a story. Learn to read it.”
💰Quotes:
“Support and resistance are the footprints of money.”
“A closed candle is a fact, an open candle is only a possibility.”
“The market doesn’t hide; it leaves clues in price action.”
“The best trades look obvious… after you’ve learned to see them.”
“Patterns are just human emotions drawn on a chart.”
The Power of Key Levels
When it comes to the stock market, key levels are like those ridiculously loud, overly dramatic friends who always know where the party’s at, or more importantly, where it’s about to end. You know, the ones who scream, “STOP! NO FURTHER!” when the price hits a certain point, or whisper, “Pssst, over here, there’s a bargain!”
Imagine a stock chart as a wild, untamed roller coaster. Key levels are those crucial points where the track either flattens out for a bit of a breather (that’s support—a comfy couch for prices), or suddenly decides to plummet or shoot for the moon (that’s resistance—a brick wall for upward ambition, or a trampoline for a bounce).
These levels aren’t just random lines drawn by bored analysts. Oh no, they’re born from the collective psyche of countless traders, all staring at their screens, hoping for a sign. When enough people collectively agree, “Yup, this price looks like a good place to buy,” you get a support level so strong, it could probably hold up a baby elephant. Conversely, if everyone’s thinking, “Time to dump this hot potato!” you hit a resistance level that acts like a bouncer at an exclusive club—no entry for higher prices!
The real power of key levels lies in their uncanny ability to make us feel like we’re almost, almost psychics. “Aha!” we exclaim, stroking our imaginary beards, “I knew it would bounce off that $100 mark! It’s obvious!” (Even though last week we thought it was going to the moon, and it went to the basement).
So, next time you’re eyeing a stock, remember the key levels. They’re not magic, but they’re darn good at telling you where the market’s been stuck in traffic, where it might take a pit stop, or where it’s finally ready to hit the open road. Just don’t expect them to do your laundry. Their powers have limits.
💰Quotes:
“Enter the trade — then sit on your hands like a monk!”
“We don’t click and panic. We click and chill.”
“Traders who wait, get paid. Traders who fidget… donate!”
“We enter the trade, then do absolutely nothing like pros.”
“Let the market work. You’re not its boss.”
💰Normal Tone Slogans:
“Enter with a plan, then let the trade play out.”
“The work is in the setup — the result comes with patience.”
“We don’t babysit trades. We trust our edge.”
“Entry is action. Waiting is discipline.”
“After entry, emotion has no place — only patience.”
Add Your Heading Text Here
Lorem ipsum dolor sit amet, consectetur adipiscing elit. Ut elit tellus, luctus nec ullamcorper mattis, pulvinar dapibus leo.

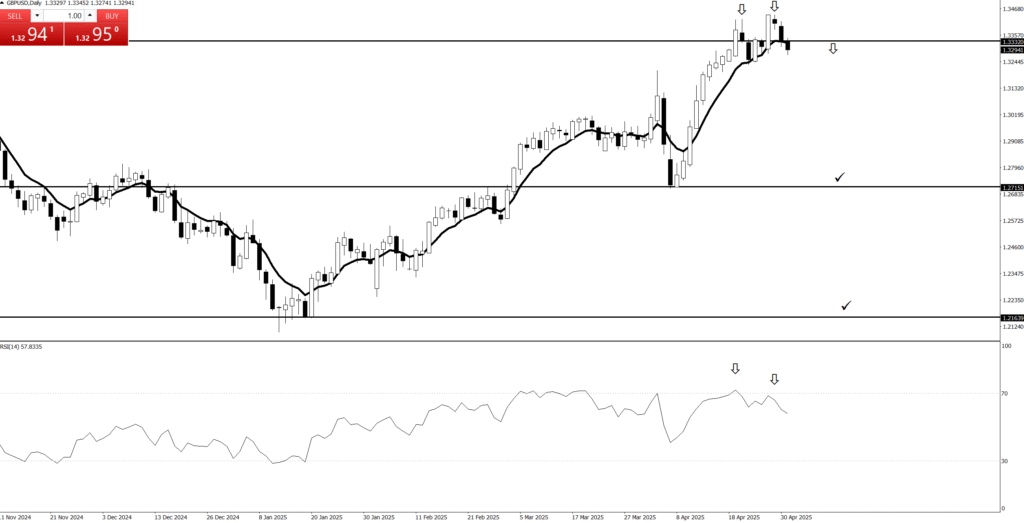
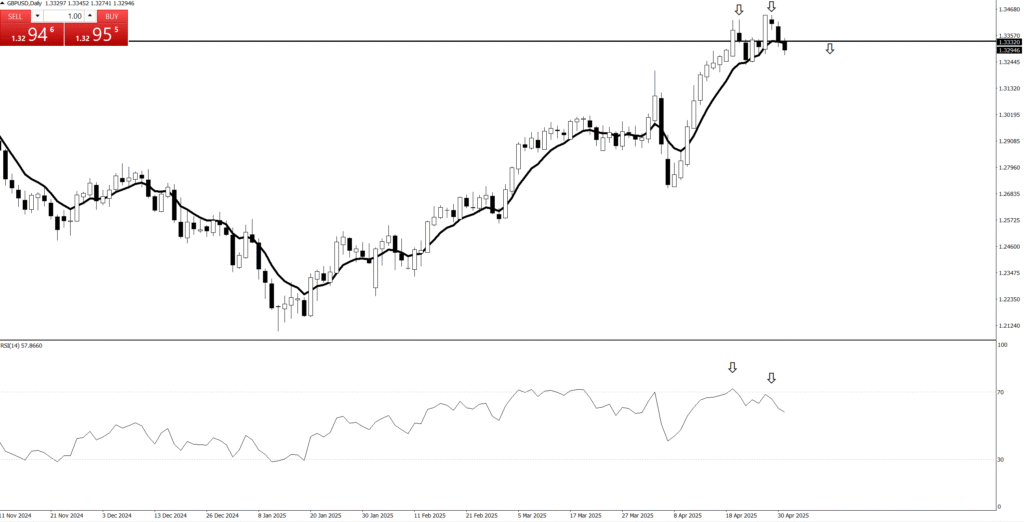
Trading Charts with Price Action: Just Reading the Market’s Face (No Brain Scans Required!)
Tired of charts that look like a spaghetti factory exploded on a rollercoaster? Good news! With Price Action, we skip the brain-melting complexity and just read the market’s own hilarious facial expressions.
Forget a thousand blinking indicators that argue with each other. We’re simply watching what the candlesticks are actually doing. Is the market confidently flexing its biceps (going up)? Is it stomping its foot like a toddler (going down)? Or is it just shrugging its shoulders in total indecision?
It’s like understanding someone’s body language without needing a translator. The price tells its own messy, dramatic, often funny story directly on the chart. So, ditch the math degree, grab your popcorn, and learn to read the market’s true emotions – unfiltered, raw, and often, surprisingly profitable!
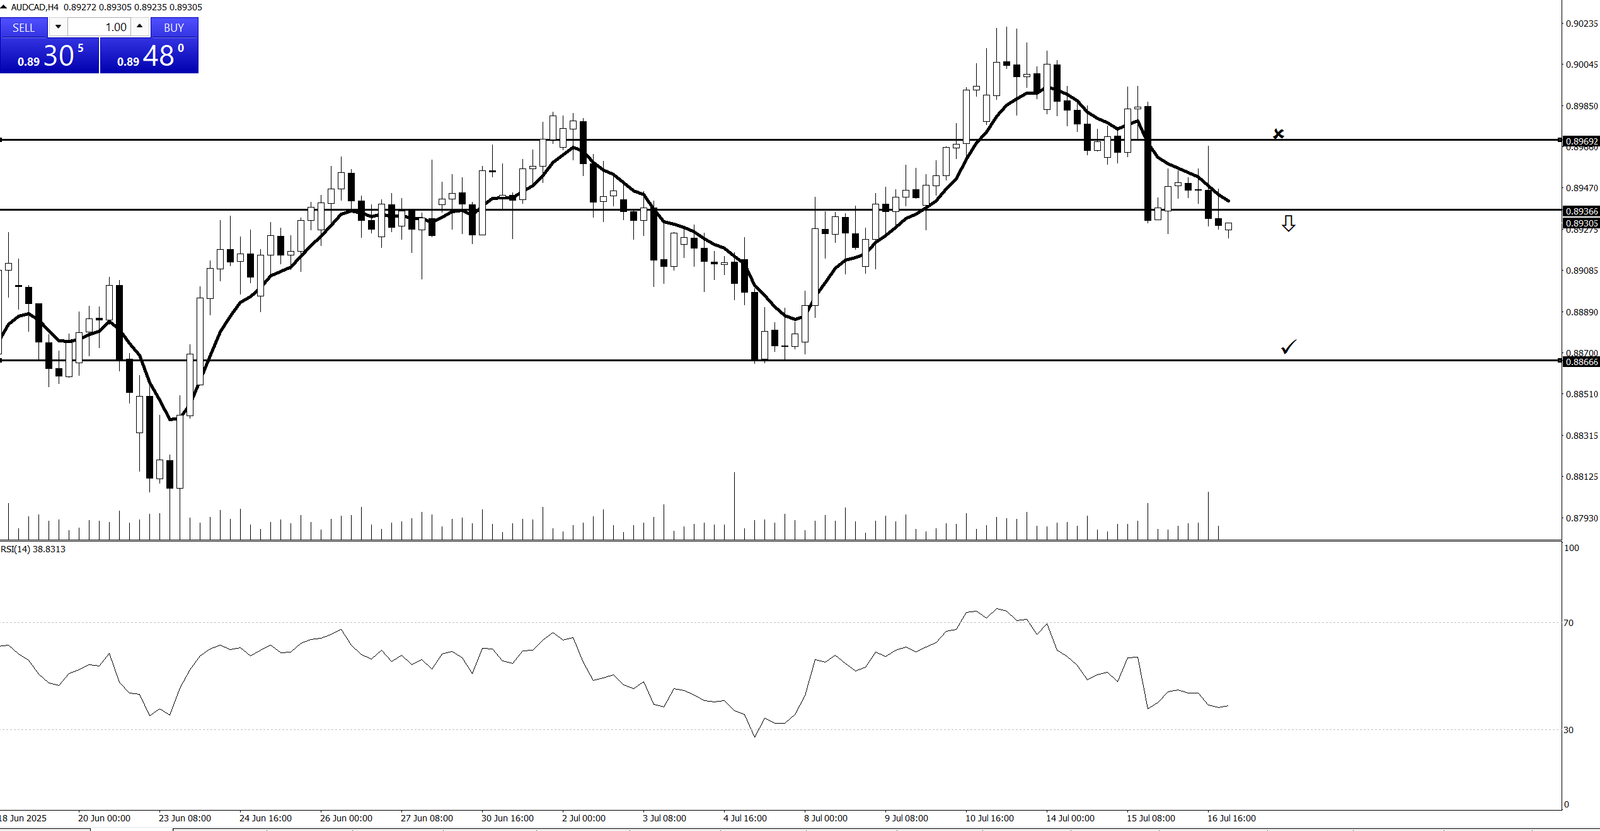
- Is the current trend bullish or bearish?
2. Is the main trend bullish or bearish on selected timeframe?
3. Where is price now? where are the keylevels?
4. Are there any Price Action?
5. Are there any failed Price Action?
6. Is there evidence that the market is getting rid of buyers or sellers?
💰“The Power of Price Action”
Quotes:
“Let Price Tell the Story.”
“Price Never Lies – Everything Else Might.”
“Trade What You See, Not What You Think.”
“Candles Speak Louder Than Indicators.”
- “The Truth is in the Candles.”
💰What Are Event Areas?
Definition: Price levels or zones where major events (like economic reports, central bank decisions, or geopolitical news) triggered big moves.
Why Important: These areas tend to have a lot of orders clustered, making them potential reversal or breakout points.
How Traders Use Them: As reference points for entries, exits, or stops because price often reacts strongly when revisiting these zones.

💰
Angle of the Trend: Is the slope steep and consistent, or shallow and bumpy? A steeper, more consistent slope often indicates a stronger, more reliable “friend.”
💰🧘 Confirming tools (at a glance):
Moving Averages: If you have them on your chart, are the prices consistently above a rising moving average (uptrend friend) or below a falling one (downtrend friend)? Are the moving averages themselves sloped in a clear direction?
Higher Highs/Higher Lows or Lower Lows/Lower Highs: Can you easily spot this “staircase” pattern?
💰In essence, your very first action is a rapid visual assessment: “Where is the market clearly trying to go?” If it’s not clearly trying to go anywhere, then your strategy (following the trend) dictates that you don’t have a trade.