Trading is essentially the art of trying to predict the next move of a caffeinated toddler—the market. One minute it’s high on sugar (uptrend), the next it’s having a meltdown on the floor (downtrend), and sometimes it just stares at a wall for three hours (sideways).
To survive without losing your sanity—or your savings—you need to understand Market Structure. This is the invisible skeleton of price action that tells you who is currently winning the tug-of-war between the “Bulls” (the optimists) and the “Bears” (the professional pessimists).
1. The Three Moods of the Market
Before you press any buttons, you need to identify the “vibe.”
📈 The Uptrend: The Motivated Hiker
In an uptrend, the market behaves like a hiker who is slightly out of breath but determined. It takes two steps up, pauses to check the map, and then continues.
Higher Highs (HH): Every peak is higher than the last.
Higher Lows (HL): Every dip stops before it reaches the previous low. If you see this, the Bulls are in charge. They are buying the dips because they have “terminal hopium.”
📉 The Downtrend: The Sad Slinky
A downtrend is what happens when the hiker trips and starts tumbling down the mountain. It’s a series of lower peaks and deeper valleys.
Lower Highs (LH): Every attempt to bounce back fails miserably.
Lower Lows (LL): Every drop goes deeper into the abyss. When the market is in a downtrend, “buying the dip” is just a fancy way of saying “catching a falling knife.”
↔️ Sideways: The Ping-Pong Match
Also known as “consolidation” or “ranging,” this is when the market has zero original ideas. Price just bounces back and forth between two invisible walls like a DVD screensaver logo.
2. Support and Resistance: Floors and Ceilings
If market structure is the map, Support and Resistance are the physical boundaries. Think of price as a bouncy ball inside a house.
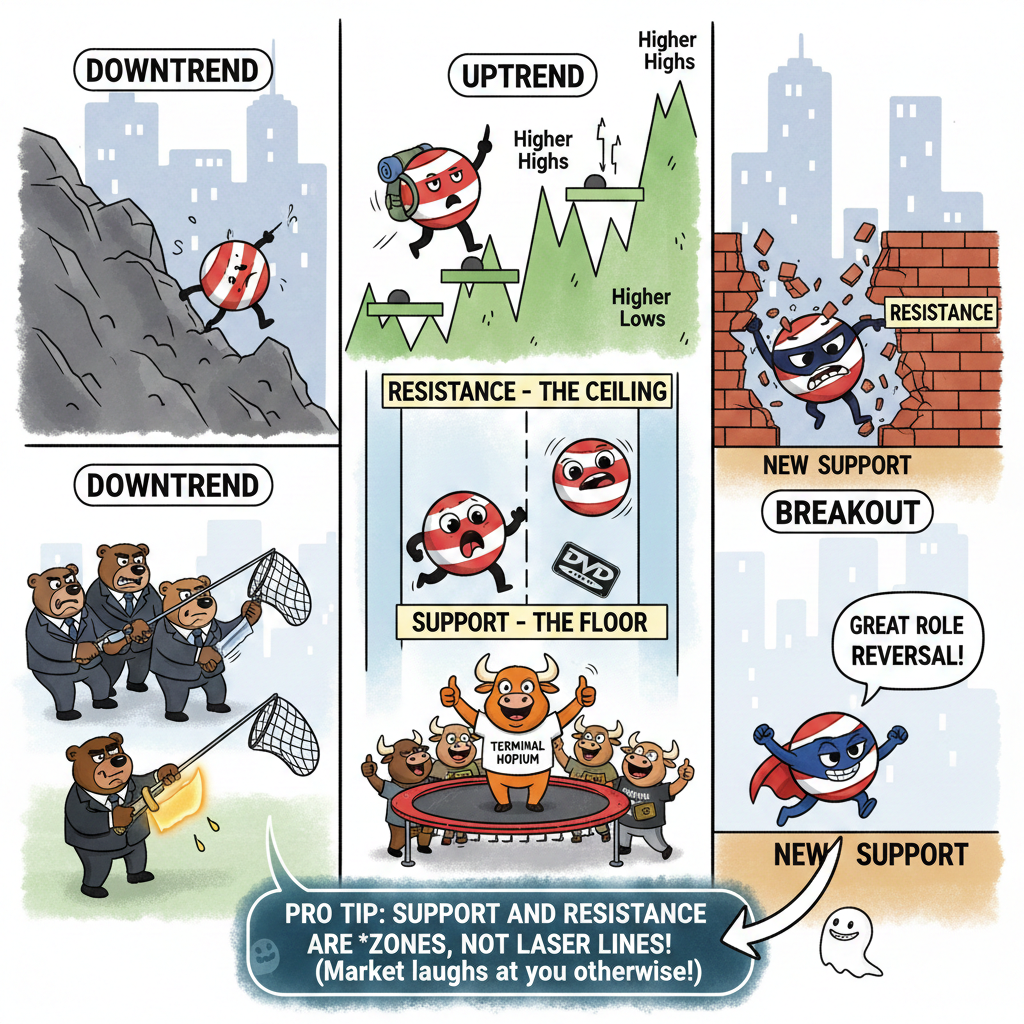
Support (The Floor): This is where price falls, hits a “trampoline” of buyers, and bounces back up. It’s the level where people say, “Hey, this is actually a bargain!”
Resistance (The Ceiling): This is the brick wall. Price rallies, hits its head, and falls back down. It’s the level where sellers say, “Okay, let’s not get carried away; it’s not worth that much.”
The Great Role Reversal
One of the weirdest things in trading is the Breakout. When price finally smashes through the ceiling (Resistance), that ceiling magically turns into the new floor (Support). It’s like moving up to the second story of a building—what was once above you is now beneath your feet.
Feature Support Resistance Analogy The Floor / Trampoline The Ceiling / Brick Wall Trader Action Buyers step in Sellers take profit Breakout Result Becomes New Resistance Becomes New Support Pro Tip: Support and resistance are zones, not laser-thin lines. Treating them like exact numbers is a great way to get “stopped out” while the market laughs at you.
Understanding these basics won’t make you a billionaire overnight, but it will stop you from trying to swim upstream when the market has clearly decided to go over a waterfall.
Would you like me to explain how to spot a “False Breakout” (the market’s favorite prank) next?
Mastering Market Structure
This video provides a deep dive into identifying swings and mapping trends to ensure you aren’t trading against the market’s primary direction.