The Power of Only Trading the Best Set-ups
What is Price Action?!
Only Trading The Best: Be a Snob, Not a Slob!
Are you still taking every lukewarm, half-baked, C-minus trade the market throws at you? Stop being a trading slob! The single greatest secret weapon held by successful professionals is the ruthless commitment to Only Trading The Best Setups—the A+ opportunities that scream “Take me, you genius!”
Trading is not a volume business. You don’t get a prize for the number of trades you place; you get a prize for the quality of the trades you win. It’s time to adopt the mindset of a financial snob and demand perfection.
The Advantages of Elite Selectivity
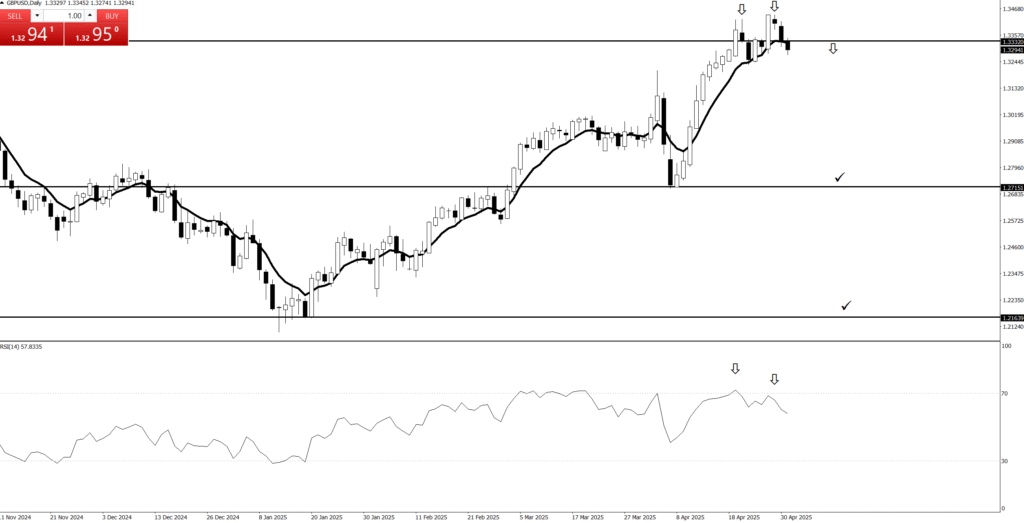
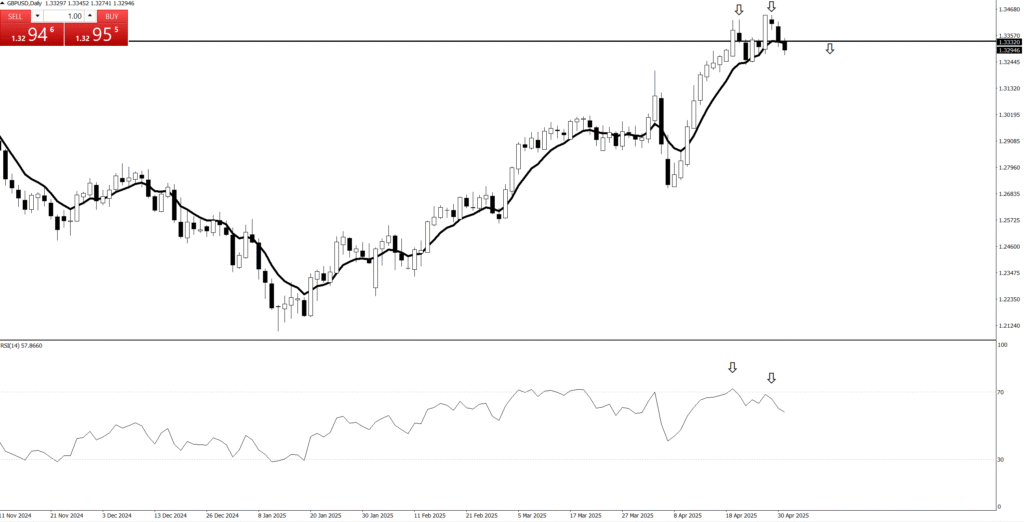
Quality Control Over Quantity: By rigorously ignoring the C and D-grade setups (the ones with messy wicks, unclear trends, and ambiguous key levels), you instantly and massively increase your overall win rate. Why chew on scraps when you can wait for the perfectly cooked, prime-cut steak? Every trade you eliminate is a potential loss avoided and a time-sink averted.
Energy Conservation and Execution Genius: Your mental focus is a finite resource. Waiting days or weeks for the absolute best setup means you are not burning mental energy on questionable charts, ambiguous entries, or unnecessary emotional swings. When that A+ trade finally appears—the textbook pullback to the 50% retracement with a clear Pin Bar—you execute flawlessly because your mind is sharp, calm, and ready. Low-quality trades breed mistakes; high-quality trades breed confidence.
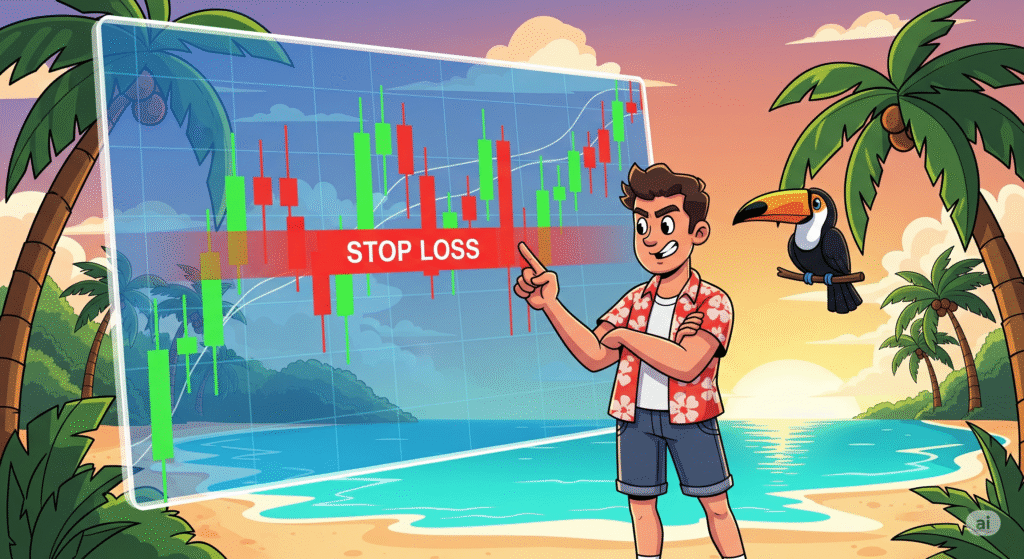
Superior Risk/Reward (R/R): The best setups are inherently the best because they provide the clearest, most logical structural points for your Stop-Loss. An A+ setup means the market has clearly defined its boundaries, allowing you to risk a minimal amount of capital for a substantial potential gain. You risk peanuts to gain a full buffet! This focus on elite
is the mathematical backbone of consistent profitability.
Discipline is the Signal: Only trading the best acts as a self-regulating mechanism. It forces patience and discipline, shielding you from the emotional compulsion of FOMO (Fear of Missing Out). You stop chasing, you stop guessing, and you start acting only on verified, high-probability facts.
Stop settling for mediocrity. Become the ruthless, demanding snob that your trading account deserves. Only the cleanest charts, the clearest patterns, and the highest setups get your valuable capital. Your wallet will thank you for being so selective!
💰Quotes:
“Price action is the only truth on the chart.”
“Everything you need to know is written in the candles.”
“Indicators lag, price action leads.”
“Trade what you see, not what you think.”
“Every candle tells a story. Learn to read it.”
💰Quotes:
“Support and resistance are the footprints of money.”
“A closed candle is a fact, an open candle is only a possibility.”
“The market doesn’t hide; it leaves clues in price action.”
“The best trades look obvious… after you’ve learned to see them.”
“Patterns are just human emotions drawn on a chart.”
What is Price Action?!
Stop Being a Market Magpie: The Power of Trading Only the Best Set-ups
You know the market. It’s that dazzling, chaotic bazaar where every bright, shiny flicker looks like a golden opportunity. Most traders are like magpies, swooping in to grab every little piece of junk they see—a trade here, a scalp there, just because it moved. They end up with a huge pile of high-stress, low-profit garbage.
But you? You’re better than that. You’re adopting the “Best Set-up Only” policy. Think of yourself as the highly selective velvet rope bouncer at the hottest financial club. You don’t let just anyone in. You wait for the VIPs, the A-Team of trades.
The Advantage: Less Is Not Only More, It’s Easier
The real power of this approach isn’t just higher profits (though that’s nice). It’s reducing your emotional and financial waste.
When you only trade your top-tier, “textbook perfect” set-ups—the ones that align perfectly with your strategy’s checklist—you accomplish three glorious things:
You Filter Out the Noise (and the Nerves): Most price movement is market static. It’s the drunken chatter outside the club. Mediocre trades are low-probability gambles that make you jumpy, leading to early exits on winners and stubbornly holding on to losers. By waiting for the obvious signal, you filter out the garbage trades that suck your account dry and your soul even drier.1
You Become a Specialist: By focusing on one or two patterns you know inside-out, you move from being a mediocre generalist to a stone-cold killer specialist. You’ll spot your perfect trade faster than a hungry wolf spots a rabbit. You trade less often, but your accuracy soars. Trading is a quality business, not a quantity one!
You Preserve Capital (and Sanity): Every time you skip a mediocre trade, you save commission costs, slippage, and—most importantly—mental bandwidth. You keep your bullet (your capital) loaded for when the target (your perfect set-up) actually appears. This patience transforms you from a frantic amateur into a cool, disciplined professional who knows that sometimes, the best trade is no trade at all.2
The market rewards the disciplined, not the busy.3 Stop frantically chasing shadows. Pick your ideal set-up, write the checklist, and sit on your hands until the market delivers exactly what you ordered. Only then do you let the VIP trade through the rope.
If you’re looking to understand the psychological edge that comes with this kind of focused patience, check out this video: Trading Psychology: The Power of Patience in Trading.
💰Quotes:
“Price action is the only truth on the chart.”
“Everything you need to know is written in the candles.”
“Indicators lag, price action leads.”
“Trade what you see, not what you think.”
“Every candle tells a story. Learn to read it.”
💰Quotes:
“Support and resistance are the footprints of money.”
“A closed candle is a fact, an open candle is only a possibility.”
“The market doesn’t hide; it leaves clues in price action.”
“The best trades look obvious… after you’ve learned to see them.”
“Patterns are just human emotions drawn on a chart.”
The Power of PriceAction
What is Price Action?!
Price action is a trading methodology that analyzes the movement of an asset’s price over time to make trading decisions. It is the foundation of technical analysis and operates on the principle that all relevant market information—including economic news, investor sentiment, and fundamental data—is already reflected in the asset’s price.
Instead of relying on lagging technical indicators, traders who use price action focus on a “naked” or clean chart. By observing historical price data, they identify patterns, trends, and key levels to predict future price direction.The core concepts of price action analysis include:Support and Resistance
These are price levels where an asset’s price has historically paused or reversed direction. A support level is a price floor where buying pressure is strong enough to prevent the price from falling further. A resistance level is a price ceiling where selling pressure is sufficient to stop the price from rising higher.
Candlestick Patterns
Candlestick charts are a primary tool for price action traders. Each candlestick represents a specific period and shows the open, high, low, and closing prices. The shape and color of the candlesticks form patterns (e.g., Doji, Hammer, Engulfing) that provide insights into market sentiment and can signal potential reversals or continuations.
Trend Analysis
Price action traders identify the market’s trend by observing the sequence of highs and lows. An uptrend is characterized by a series of higher highs and higher lows, while a downtrend is marked by lower highs and lower lows. A break in this sequence can indicate a potential trend reversal.
💰Quotes:
“Price action is the only truth on the chart.”
“Everything you need to know is written in the candles.”
“Indicators lag, price action leads.”
“Trade what you see, not what you think.”
“Every candle tells a story. Learn to read it.”
💰Quotes:
“Support and resistance are the footprints of money.”
“A closed candle is a fact, an open candle is only a possibility.”
“The market doesn’t hide; it leaves clues in price action.”
“The best trades look obvious… after you’ve learned to see them.”
“Patterns are just human emotions drawn on a chart.”
The Power of PriceAction
💰What in the Kraken’s Name is Price Action?
Imagine you’re on a bustling market street, and everyone’s shouting their prices for pineapples. You don’t need a fancy economist with a spreadsheet to tell you if pineapples are getting more popular or less. You just watch what people are doing: are they eagerly snatching them up at higher prices, or are the vendors struggling to give them away?
Price action is exactly that, but for stocks and other assets! It’s simply reading the story the market is telling you directly through the price itself. No need for complicated, lagging indicators that are always a step behind, like a tired parrot squawking old news. You’re looking at the raw, unfiltered moves on your chart – the ultimate truth of supply and demand, fear and greed.
💰Why is it the Golden Compass of Trading?
Forget trying to navigate with a half-broken sextant! Price action is your North Star, your most reliable guide:
It’s the OG (Original Gangster) Signal: Every indicator you see on a chart is derived from price. Price action is the price. It’s the source code, the main event, the real deal. When you’re looking at price action, you’re getting the news straight from the horse’s mouth, not through a dozen gossipy villagers.
No Lag, Just Action! Imagine trying to surf a wave by looking at where the last wave broke. You’d be wiped out! Many indicators are “lagging,” meaning they tell you what already happened. Price action is live, in the moment, allowing you to catch the wave as it forms. This means quicker decisions, tighter entries, and less time being swept away by unexpected currents.
Simpler Than a Coconut Cocktail: You don’t need a supercomputer or a massive collection of complex tools. A clean chart, your trusty eyeballs, and a basic understanding of candlestick patterns are often all you need. This simplicity reduces overwhelm and helps you make clear, decisive calls without second-guessing.
The Trend is Your Best Mate! Remember that wise old saying, “the trend is your friend”? Price action is the ultimate wingman for spotting that friend! It’s super easy to see if the market is clearly sailing upwards (making higher highs and higher lows), diving downwards (lower lows and lower highs), or just bobbing around in the doldrums. If the trend is clear, you know exactly which direction to point your ship. If it’s messy, price action tells you to stay ashore and enjoy a pineapple smoothie!
💰How to Read the Market’s Secret Diary (The Candlesticks!)
Each little candle on your chart is like a tiny scroll, telling you a mini-story of what happened during that time period (a minute, an hour, a day).
The Body: This is the fat part of the candle. A long green (or white) body means buyers were in control, pushing the price way up. A long red (or black) body means sellers dominated, sending the price tumbling. Think of it as a tug-of-war: who won that round?
The Wicks (or Shadows): These thin lines sticking out from the top and bottom are like antennae, showing you how far the price tried to go but got rejected. A long upper wick means buyers tried to push it high but sellers dragged it back down. A long lower wick means sellers tried to push it low but buyers bravely picked it up. These wicks often whisper secrets about exhaustion or reversals!
By watching how these candles form patterns – like a “Hammer” hitting rock bottom and bouncing back up (a sign of buyers coming to the rescue!), or an “Engulfing” pattern where one big candle swallows the previous one (a dramatic shift in power!) – you start to predict where the currents might take you next.
So, next time you’re charting your course, clear your deck, breathe in that salty air, and let the price action speak to you. It’s the most direct, most powerful, and frankly, the most fun way to understand what’s truly happening in the market and chart your way to potential success!
💰Quotes:
“Price action is the only truth on the chart.”
“Everything you need to know is written in the candles.”
“Indicators lag, price action leads.”
“Trade what you see, not what you think.”
“Every candle tells a story. Learn to read it.”
💰Quotes:
“Support and resistance are the footprints of money.”
“A closed candle is a fact, an open candle is only a possibility.”
“The market doesn’t hide; it leaves clues in price action.”
“The best trades look obvious… after you’ve learned to see them.”
“Patterns are just human emotions drawn on a chart.”
💰Quotes:
“Price action: the art of staring at candles until they confess.”
“Indicators are like rumors; price action is the witness.”
“Trading without price action is like driving blindfolded.”
“Sometimes the best trade is to just let the candle close.”
“If you can’t find the trend, step back and squint—price action is waving at you.”
💰Quotes:
“Enter the trade — then sit on your hands like a monk!”
“We don’t click and panic. We click and chill.”
“Traders who wait, get paid. Traders who fidget… donate!”
“We enter the trade, then do absolutely nothing like pros.”
“Let the market work. You’re not its boss.”
💰Quotes:
“Enter the trade — then sit on your hands like a monk!”
“We don’t click and panic. We click and chill.”
“Traders who wait, get paid. Traders who fidget… donate!”
“We enter the trade, then do absolutely nothing like pros.”
“Let the market work. You’re not its boss.”
💰Quotes:
“Enter the trade — then sit on your hands like a monk!”
“We don’t click and panic. We click and chill.”
“Traders who wait, get paid. Traders who fidget… donate!”
“We enter the trade, then do absolutely nothing like pros.”
“Let the market work. You’re not its boss.”
Add Your Heading Text Here
The Power of PriceAction
What is Price Action?!
Price action is a trading methodology that analyzes the movement of an asset’s price over time to make trading decisions. It is the foundation of technical analysis and operates on the principle that all relevant market information—including economic news, investor sentiment, and fundamental data—is already reflected in the asset’s price.
Instead of relying on lagging technical indicators, traders who use price action focus on a “naked” or clean chart. By observing historical price data, they identify patterns, trends, and key levels to predict future price direction.The core concepts of price action analysis include:Support and Resistance
These are price levels where an asset’s price has historically paused or reversed direction. A support level is a price floor where buying pressure is strong enough to prevent the price from falling further. A resistance level is a price ceiling where selling pressure is sufficient to stop the price from rising higher.
Candlestick Patterns
Candlestick charts are a primary tool for price action traders. Each candlestick represents a specific period and shows the open, high, low, and closing prices. The shape and color of the candlesticks form patterns (e.g., Doji, Hammer, Engulfing) that provide insights into market sentiment and can signal potential reversals or continuations.
Trend Analysis
Price action traders identify the market’s trend by observing the sequence of highs and lows. An uptrend is characterized by a series of higher highs and higher lows, while a downtrend is marked by lower highs and lower lows. A break in this sequence can indicate a potential trend reversal.
💰Quotes:
“Price action is the only truth on the chart.”
“Everything you need to know is written in the candles.”
“Indicators lag, price action leads.”
“Trade what you see, not what you think.”
“Every candle tells a story. Learn to read it.”
💰Quotes:
“Support and resistance are the footprints of money.”
“A closed candle is a fact, an open candle is only a possibility.”
“The market doesn’t hide; it leaves clues in price action.”
“The best trades look obvious… after you’ve learned to see them.”
“Patterns are just human emotions drawn on a chart.”
The Power of PriceAction
What is Price Action?!
Price action is a trading methodology that analyzes the movement of an asset’s price over time to make trading decisions. It is the foundation of technical analysis and operates on the principle that all relevant market information—including economic news, investor sentiment, and fundamental data—is already reflected in the asset’s price.
Instead of relying on lagging technical indicators, traders who use price action focus on a “naked” or clean chart. By observing historical price data, they identify patterns, trends, and key levels to predict future price direction.The core concepts of price action analysis include:Support and Resistance
These are price levels where an asset’s price has historically paused or reversed direction. A support level is a price floor where buying pressure is strong enough to prevent the price from falling further. A resistance level is a price ceiling where selling pressure is sufficient to stop the price from rising higher.
Candlestick Patterns
Candlestick charts are a primary tool for price action traders. Each candlestick represents a specific period and shows the open, high, low, and closing prices. The shape and color of the candlesticks form patterns (e.g., Doji, Hammer, Engulfing) that provide insights into market sentiment and can signal potential reversals or continuations.
Trend Analysis
Price action traders identify the market’s trend by observing the sequence of highs and lows. An uptrend is characterized by a series of higher highs and higher lows, while a downtrend is marked by lower highs and lower lows. A break in this sequence can indicate a potential trend reversal.
4. Stop Loss
Let’s talk about the unsung hero of our trading strategy, the silent guardian, the watchful protector: the stop-loss.
Our Love-Hate Relationship with the Stop-Loss
Here at [Your Company/Team Name, or “our trading desk”], we’ve got a profound, albeit slightly complicated, relationship with the stop-loss. Think of it like that super-responsible friend who always makes sure you don’t do anything too stupid on a wild night out. You might grumble when they pull you away from that questionable decision, but you’re eternally grateful the next morning when you’re not missing an eyebrow.
That’s our stop-loss. It’s the designated driver for our trades, preventing us from driving our accounts straight into a ditch at 100 miles an hour while screaming, “It’s just a temporary dip! It’ll come back!” (Spoiler alert: it usually doesn’t, not without taking your entire portfolio with it.)
Why We Embrace the “Slightly Painful Nudge”
Some traders, bless their optimistic hearts, view a stop-loss as a personal insult, a sign of weakness, or perhaps a tiny financial guillotine. They’d rather ride a losing trade down to zero, hoping for a miraculous turnaround, like waiting for a flat tire to reinflate itself through sheer willpower.
Not us. We’ve learned that a small, controlled loss is like a tiny paper cut compared to the gaping financial wound of a blown-up account. When our stop-loss gets hit, it’s not a defeat; it’s the market gently (or sometimes firmly) nudging us with a sticky note that says, “Hey, genius, your idea was wrong. Time to exit and rethink your life choices… or at least your next trade.”
The Unspoken Benefits of Our Stop-Loss Obsession
Sleep: Believe it or not, knowing your downside is capped lets you actually close your eyes at night without visions of red numbers dancing in your head. It’s truly revolutionary.
Sanity: Less emotional attachment to a dying trade means fewer arguments with your spouse about why you’re glued to the screen muttering about “support levels.”
Capital Preservation: This is fancy talk for “not losing all your money.” Our stop-loss is like a tiny, vigilant bodyguard for our trading capital, always ready to step in and say, “Alright, that’s enough fun for today.”
The Freedom to Be Wrong (Often!): Since we accept small losses, we’re not afraid to try new things. We know that if a trade goes sideways, our trusty stop-loss will catch us before we fall into the abyss of regret.
So, yes, we use stop-losses. Not because we’re pessimists, but because we’re realists who prefer controlled exits over catastrophic explosions. And honestly, it leaves us with more money for coffee and other vital trading supplies
💰Quotes:
“Enter the trade — then sit on your hands like a monk!”
“We don’t click and panic. We click and chill.”
“Traders who wait, get paid. Traders who fidget… donate!”
“We enter the trade, then do absolutely nothing like pros.”
“Let the market work. You’re not its boss.”
💰Normal Tone Slogans:
“Enter with a plan, then let the trade play out.”
“The work is in the setup — the result comes with patience.”
“We don’t babysit trades. We trust our edge.”
“Entry is action. Waiting is discipline.”
“After entry, emotion has no place — only patience.”
Price Action: From Chaos to Clarity
💰What in the Kraken’s Name is Price Action?
Imagine you’re on a bustling market street, and everyone’s shouting their prices for pineapples. You don’t need a fancy economist with a spreadsheet to tell you if pineapples are getting more popular or less. You just watch what people are doing: are they eagerly snatching them up at higher prices, or are the vendors struggling to give them away?
Price action is exactly that, but for stocks and other assets! It’s simply reading the story the market is telling you directly through the price itself. No need for complicated, lagging indicators that are always a step behind, like a tired parrot squawking old news. You’re looking at the raw, unfiltered moves on your chart – the ultimate truth of supply and demand, fear and greed.
💰Why is it the Golden Compass of Trading?
Forget trying to navigate with a half-broken sextant! Price action is your North Star, your most reliable guide:
It’s the OG (Original Gangster) Signal: Every indicator you see on a chart is derived from price. Price action is the price. It’s the source code, the main event, the real deal. When you’re looking at price action, you’re getting the news straight from the horse’s mouth, not through a dozen gossipy villagers.
No Lag, Just Action! Imagine trying to surf a wave by looking at where the last wave broke. You’d be wiped out! Many indicators are “lagging,” meaning they tell you what already happened. Price action is live, in the moment, allowing you to catch the wave as it forms. This means quicker decisions, tighter entries, and less time being swept away by unexpected currents.
Simpler Than a Coconut Cocktail: You don’t need a supercomputer or a massive collection of complex tools. A clean chart, your trusty eyeballs, and a basic understanding of candlestick patterns are often all you need. This simplicity reduces overwhelm and helps you make clear, decisive calls without second-guessing.
The Trend is Your Best Mate! Remember that wise old saying, “the trend is your friend”? Price action is the ultimate wingman for spotting that friend! It’s super easy to see if the market is clearly sailing upwards (making higher highs and higher lows), diving downwards (lower lows and lower highs), or just bobbing around in the doldrums. If the trend is clear, you know exactly which direction to point your ship. If it’s messy, price action tells you to stay ashore and enjoy a pineapple smoothie!
💰How to Read the Market’s Secret Diary (The Candlesticks!)
Each little candle on your chart is like a tiny scroll, telling you a mini-story of what happened during that time period (a minute, an hour, a day).
The Body: This is the fat part of the candle. A long green (or white) body means buyers were in control, pushing the price way up. A long red (or black) body means sellers dominated, sending the price tumbling. Think of it as a tug-of-war: who won that round?
The Wicks (or Shadows): These thin lines sticking out from the top and bottom are like antennae, showing you how far the price tried to go but got rejected. A long upper wick means buyers tried to push it high but sellers dragged it back down. A long lower wick means sellers tried to push it low but buyers bravely picked it up. These wicks often whisper secrets about exhaustion or reversals!
By watching how these candles form patterns – like a “Hammer” hitting rock bottom and bouncing back up (a sign of buyers coming to the rescue!), or an “Engulfing” pattern where one big candle swallows the previous one (a dramatic shift in power!) – you start to predict where the currents might take you next.
So, next time you’re charting your course, clear your deck, breathe in that salty air, and let the price action speak to you. It’s the most direct, most powerful, and frankly, the most fun way to understand what’s truly happening in the market and chart your way to potential success!
💰Quotes:
“Enter the trade — then sit on your hands like a monk!”
“We don’t click and panic. We click and chill.”
“Traders who wait, get paid. Traders who fidget… donate!”
“We enter the trade, then do absolutely nothing like pros.”
“Let the market work. You’re not its boss.”
💰Normal Tone Slogans:
“Enter with a plan, then let the trade play out.”
“The work is in the setup — the result comes with patience.”
“We don’t babysit trades. We trust our edge.”
“Entry is action. Waiting is discipline.”
“After entry, emotion has no place — only patience.”
The Power of StopLoss
What is Price Action?!
Price action is a trading methodology that analyzes the movement of an asset’s price over time to make trading decisions. It is the foundation of technical analysis and operates on the principle that all relevant market information—including economic news, investor sentiment, and fundamental data—is already reflected in the asset’s price.
Instead of relying on lagging technical indicators, traders who use price action focus on a “naked” or clean chart. By observing historical price data, they identify patterns, trends, and key levels to predict future price direction.The core concepts of price action analysis include:Support and Resistance
These are price levels where an asset’s price has historically paused or reversed direction. A support level is a price floor where buying pressure is strong enough to prevent the price from falling further. A resistance level is a price ceiling where selling pressure is sufficient to stop the price from rising higher.
Candlestick Patterns
Candlestick charts are a primary tool for price action traders. Each candlestick represents a specific period and shows the open, high, low, and closing prices. The shape and color of the candlesticks form patterns (e.g., Doji, Hammer, Engulfing) that provide insights into market sentiment and can signal potential reversals or continuations.
Trend Analysis
Price action traders identify the market’s trend by observing the sequence of highs and lows. An uptrend is characterized by a series of higher highs and higher lows, while a downtrend is marked by lower highs and lower lows. A break in this sequence can indicate a potential trend reversal.
💰Quotes:
“Price action is the only truth on the chart.”
“Everything you need to know is written in the candles.”
“Indicators lag, price action leads.”
“Trade what you see, not what you think.”
“Every candle tells a story. Learn to read it.”
💰Quotes:
“Support and resistance are the footprints of money.”
“A closed candle is a fact, an open candle is only a possibility.”
“The market doesn’t hide; it leaves clues in price action.”
“The best trades look obvious… after you’ve learned to see them.”
“Patterns are just human emotions drawn on a chart.”
The Power of PriceAction
What is Price Action?!
Price action is a trading methodology that analyzes the movement of an asset’s price over time to make trading decisions. It is the foundation of technical analysis and operates on the principle that all relevant market information—including economic news, investor sentiment, and fundamental data—is already reflected in the asset’s price.
Instead of relying on lagging technical indicators, traders who use price action focus on a “naked” or clean chart. By observing historical price data, they identify patterns, trends, and key levels to predict future price direction.The core concepts of price action analysis include:Support and Resistance
These are price levels where an asset’s price has historically paused or reversed direction. A support level is a price floor where buying pressure is strong enough to prevent the price from falling further. A resistance level is a price ceiling where selling pressure is sufficient to stop the price from rising higher.
Candlestick Patterns
Candlestick charts are a primary tool for price action traders. Each candlestick represents a specific period and shows the open, high, low, and closing prices. The shape and color of the candlesticks form patterns (e.g., Doji, Hammer, Engulfing) that provide insights into market sentiment and can signal potential reversals or continuations.
Trend Analysis
Price action traders identify the market’s trend by observing the sequence of highs and lows. An uptrend is characterized by a series of higher highs and higher lows, while a downtrend is marked by lower highs and lower lows. A break in this sequence can indicate a potential trend reversal.
💰Quotes:
“Price action is the only truth on the chart.”
“Everything you need to know is written in the candles.”
“Indicators lag, price action leads.”
“Trade what you see, not what you think.”
“Every candle tells a story. Learn to read it.”
💰Quotes:
“Support and resistance are the footprints of money.”
“A closed candle is a fact, an open candle is only a possibility.”
“The market doesn’t hide; it leaves clues in price action.”
“The best trades look obvious… after you’ve learned to see them.”
“Patterns are just human emotions drawn on a chart.”
The Power of PriceAction
💰What in the Kraken’s Name is Price Action?
Imagine you’re on a bustling market street, and everyone’s shouting their prices for pineapples. You don’t need a fancy economist with a spreadsheet to tell you if pineapples are getting more popular or less. You just watch what people are doing: are they eagerly snatching them up at higher prices, or are the vendors struggling to give them away?
Price action is exactly that, but for stocks and other assets! It’s simply reading the story the market is telling you directly through the price itself. No need for complicated, lagging indicators that are always a step behind, like a tired parrot squawking old news. You’re looking at the raw, unfiltered moves on your chart – the ultimate truth of supply and demand, fear and greed.
💰Why is it the Golden Compass of Trading?
Forget trying to navigate with a half-broken sextant! Price action is your North Star, your most reliable guide:
It’s the OG (Original Gangster) Signal: Every indicator you see on a chart is derived from price. Price action is the price. It’s the source code, the main event, the real deal. When you’re looking at price action, you’re getting the news straight from the horse’s mouth, not through a dozen gossipy villagers.
No Lag, Just Action! Imagine trying to surf a wave by looking at where the last wave broke. You’d be wiped out! Many indicators are “lagging,” meaning they tell you what already happened. Price action is live, in the moment, allowing you to catch the wave as it forms. This means quicker decisions, tighter entries, and less time being swept away by unexpected currents.
Simpler Than a Coconut Cocktail: You don’t need a supercomputer or a massive collection of complex tools. A clean chart, your trusty eyeballs, and a basic understanding of candlestick patterns are often all you need. This simplicity reduces overwhelm and helps you make clear, decisive calls without second-guessing.
The Trend is Your Best Mate! Remember that wise old saying, “the trend is your friend”? Price action is the ultimate wingman for spotting that friend! It’s super easy to see if the market is clearly sailing upwards (making higher highs and higher lows), diving downwards (lower lows and lower highs), or just bobbing around in the doldrums. If the trend is clear, you know exactly which direction to point your ship. If it’s messy, price action tells you to stay ashore and enjoy a pineapple smoothie!
💰How to Read the Market’s Secret Diary (The Candlesticks!)
Each little candle on your chart is like a tiny scroll, telling you a mini-story of what happened during that time period (a minute, an hour, a day).
The Body: This is the fat part of the candle. A long green (or white) body means buyers were in control, pushing the price way up. A long red (or black) body means sellers dominated, sending the price tumbling. Think of it as a tug-of-war: who won that round?
The Wicks (or Shadows): These thin lines sticking out from the top and bottom are like antennae, showing you how far the price tried to go but got rejected. A long upper wick means buyers tried to push it high but sellers dragged it back down. A long lower wick means sellers tried to push it low but buyers bravely picked it up. These wicks often whisper secrets about exhaustion or reversals!
By watching how these candles form patterns – like a “Hammer” hitting rock bottom and bouncing back up (a sign of buyers coming to the rescue!), or an “Engulfing” pattern where one big candle swallows the previous one (a dramatic shift in power!) – you start to predict where the currents might take you next.
So, next time you’re charting your course, clear your deck, breathe in that salty air, and let the price action speak to you. It’s the most direct, most powerful, and frankly, the most fun way to understand what’s truly happening in the market and chart your way to potential success!
💰Quotes:
“Price action is the only truth on the chart.”
“Everything you need to know is written in the candles.”
“Indicators lag, price action leads.”
“Trade what you see, not what you think.”
“Every candle tells a story. Learn to read it.”
💰Quotes:
“Support and resistance are the footprints of money.”
“A closed candle is a fact, an open candle is only a possibility.”
“The market doesn’t hide; it leaves clues in price action.”
“The best trades look obvious… after you’ve learned to see them.”
“Patterns are just human emotions drawn on a chart.”
💰Quotes:
“Price action: the art of staring at candles until they confess.”
“Indicators are like rumors; price action is the witness.”
“Trading without price action is like driving blindfolded.”
“Sometimes the best trade is to just let the candle close.”
“If you can’t find the trend, step back and squint—price action is waving at you.”
💰Quotes:
“Enter the trade — then sit on your hands like a monk!”
“We don’t click and panic. We click and chill.”
“Traders who wait, get paid. Traders who fidget… donate!”
“We enter the trade, then do absolutely nothing like pros.”
“Let the market work. You’re not its boss.”
💰Quotes:
“Enter the trade — then sit on your hands like a monk!”
“We don’t click and panic. We click and chill.”
“Traders who wait, get paid. Traders who fidget… donate!”
“We enter the trade, then do absolutely nothing like pros.”
“Let the market work. You’re not its boss.”
💰Quotes:
“Enter the trade — then sit on your hands like a monk!”
“We don’t click and panic. We click and chill.”
“Traders who wait, get paid. Traders who fidget… donate!”
“We enter the trade, then do absolutely nothing like pros.”
“Let the market work. You’re not its boss.”
Add Your Heading Text Here
The Power of PriceAction
What is Price Action?!
Price action is a trading methodology that analyzes the movement of an asset’s price over time to make trading decisions. It is the foundation of technical analysis and operates on the principle that all relevant market information—including economic news, investor sentiment, and fundamental data—is already reflected in the asset’s price.
Instead of relying on lagging technical indicators, traders who use price action focus on a “naked” or clean chart. By observing historical price data, they identify patterns, trends, and key levels to predict future price direction.The core concepts of price action analysis include:Support and Resistance
These are price levels where an asset’s price has historically paused or reversed direction. A support level is a price floor where buying pressure is strong enough to prevent the price from falling further. A resistance level is a price ceiling where selling pressure is sufficient to stop the price from rising higher.
Candlestick Patterns
Candlestick charts are a primary tool for price action traders. Each candlestick represents a specific period and shows the open, high, low, and closing prices. The shape and color of the candlesticks form patterns (e.g., Doji, Hammer, Engulfing) that provide insights into market sentiment and can signal potential reversals or continuations.
Trend Analysis
Price action traders identify the market’s trend by observing the sequence of highs and lows. An uptrend is characterized by a series of higher highs and higher lows, while a downtrend is marked by lower highs and lower lows. A break in this sequence can indicate a potential trend reversal.
💰Quotes:
“Price action is the only truth on the chart.”
“Everything you need to know is written in the candles.”
“Indicators lag, price action leads.”
“Trade what you see, not what you think.”
“Every candle tells a story. Learn to read it.”
💰Quotes:
“Support and resistance are the footprints of money.”
“A closed candle is a fact, an open candle is only a possibility.”
“The market doesn’t hide; it leaves clues in price action.”
“The best trades look obvious… after you’ve learned to see them.”
“Patterns are just human emotions drawn on a chart.”
25. We Trade the Best Set-Ups Only
Alright, my discerning market connoisseurs! You’ve just hit the nail on the head, delivered the secret handshake, and unlocked the golden gates to the “Traders Who Actually Make Money” club!
You said it: “We only trade the best set-ups!”
This isn’t just a mantra; it’s the entire business plan for sane, profitable trading!
“The Best Set-ups”: Because Life’s Too Short for Mediocre Markets!
Imagine you’re in Barcelona, known for its incredible food. You could:
- Option A (The “Rookie Trader” Approach): Chase every faint smell of cooking. “Is that… a hint of garlic? Could it be a Michelin-star restaurant? No, wait, it’s just someone’s grandmother making toast. Oh well, I’ll eat the toast! Maybe it’ll turn into paella later!” You end up eating a lot of burnt toast, stale bread, and questionable street snacks, constantly disappointed.
- Option B (The “Professional Trader” Approach): You consult your meticulously researched food guide (your checklist!). You ignore the mediocre tourist traps. You wait patiently, perhaps sipping a fine vermouth, until you find the restaurant with the line out the door, the gleaming reviews, the aroma of perfection, and that unmistakable, flashing sign that says: “AUTHENTIC PAELLA! THIS IS IT! YOU WILL NOT REGRET THIS!”
That, my friends, is the difference!
Why Only Trading the “Best Set-ups” is Your Ticket to the Good Life (and Less Hair Loss!):
- It’s the Market Screaming, Not Whispering (Again!): Forget the faint murmurs. The “best set-ups” are when the market isn’t just hinting; it’s practically yelling its intentions, waving giant flags, and pointing neon arrows. “Hey! Over here! I’m about to make a big move!”
- The “Velvet Rope” Strategy: You’re not desperate. You’re not going to enter just any trade. You’re waiting for the market equivalent of a VIP section at a exclusive beach club. It’s got to be high-probability, high-reward, and perfectly align with your checklist. If it doesn’t meet the criteria, you politely decline, shrug, and wait for the next, even better, invitation.
- Confluence of Awesomeness: A “best set-up” isn’t just one thing. It’s when everything lines up:
- The trend is your buddy, singing happy songs.
- The price action is telling a clear, undeniable story (no more ambiguous wicks!).
- You’re at a powerful event area (the market’s drama hotspot!).
- Your RSI isn’t having a meltdown.
- And most importantly, your checklist is practically singing a triumphant opera!
- Quality Over Quantity (Less Stress, More Siestas!): Why chase 10 mediocre trades, risking your capital and sanity, when you can wait for 2-3 truly stellar ones that have a much higher chance of paying off handsomely? It’s like preferring a few perfectly cooked gourmet tapas over a giant, bland, all-you-can-eat buffet. Less effort, more satisfaction.
- Your Sanity Stays Intact: Chasing every little flicker is exhausting. Trading only the best setups means less screen time, less emotional rollercoasters, and more time for actual life – like enjoying the Mediterranean sunshine or perfecting your sangria recipe.
So, yes! We only trade the best set-ups! Because we’re not desperate market-chasers; we’re discerning, patient, and wise traders who understand that true success comes not from busy work, but from waiting for those undeniable, screaming, perfectly aligned opportunities that are too good to ignore. Now, if you’ll excuse me, I hear the market calling… but only for a very, very specific, highly qualified reason.
💰Quotes:
“Enter the trade — then sit on your hands like a monk!”
“We don’t click and panic. We click and chill.”
“Traders who wait, get paid. Traders who fidget… donate!”
“We enter the trade, then do absolutely nothing like pros.”
“Let the market work. You’re not its boss.”
💰Normal Tone Slogans:
“Enter with a plan, then let the trade play out.”
“The work is in the setup — the result comes with patience.”
“We don’t babysit trades. We trust our edge.”
“Entry is action. Waiting is discipline.”
“After entry, emotion has no place — only patience.”