PinBar Entry
Price action is a trading methodology that analyzes the movement of an asset’s price over time to make trading decisions. It is the foundation of technical analysis and operates on the principle that all relevant market information—including economic news, investor sentiment, and fundamental data—is already reflected in the asset’s price.
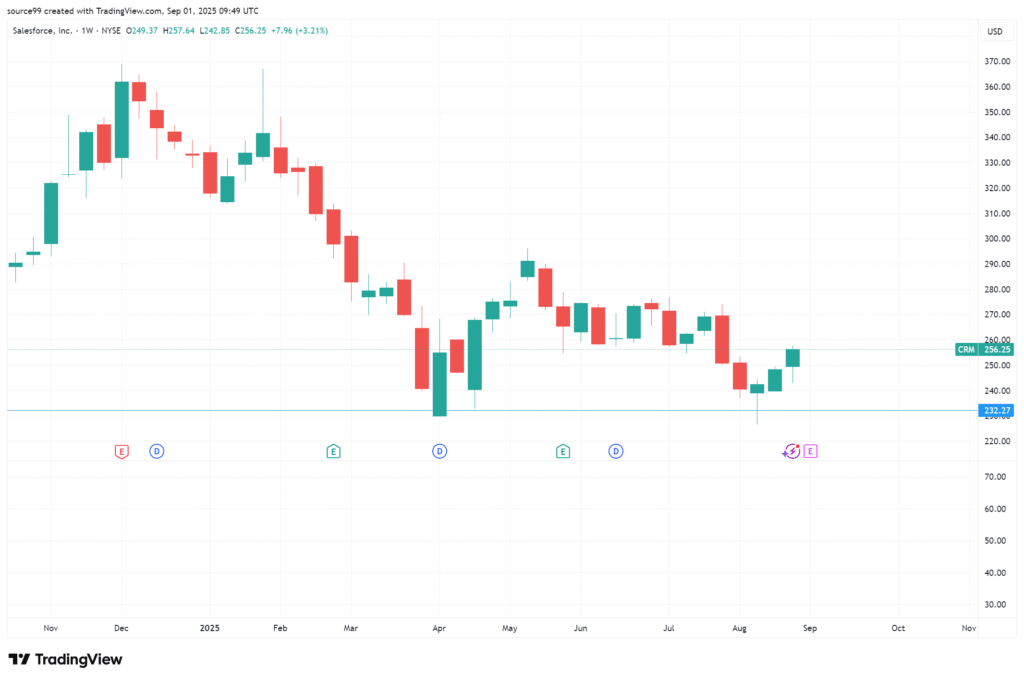
Instead of relying on lagging technical indicators, traders who use price action focus on a “naked” or clean chart. By observing historical price data, they identify patterns, trends, and key levels to predict future price direction.The core concepts of price action analysis include:Support and Resistance
These are price levels where an asset’s price has historically paused or reversed direction. A support level is a price floor where buying pressure is strong enough to prevent the price from falling further. A resistance level is a price ceiling where selling pressure is sufficient to stop the price from rising higher.
Candlestick Patterns
Candlestick charts are a primary tool for price action traders. Each candlestick represents a specific period and shows the open, high, low, and closing prices. The shape and color of the candlesticks form patterns (e.g., Doji, Hammer, Engulfing) that provide insights into market sentiment and can signal potential reversals or continuations.
Trend Analysis
Price action traders identify the market’s trend by observing the sequence of highs and lows. An uptrend is characterized by a series of higher highs and higher lows, while a downtrend is marked by lower highs and lower lows. A break in this sequence can indicate a potential trend reversal.
Add Your Heading Text Here
Add Your Heading Text Here
PinBar Entry
Price action is a trading methodology that analyzes the movement of an asset’s price over time to make trading decisions. It is the foundation of technical analysis and operates on the principle that all relevant market information—including economic news, investor sentiment, and fundamental data—is already reflected in the asset’s price.
Instead of relying on lagging technical indicators, traders who use price action focus on a “naked” or clean chart. By observing historical price data, they identify patterns, trends, and key levels to predict future price direction.The core concepts of price action analysis include:Support and Resistance
These are price levels where an asset’s price has historically paused or reversed direction. A support level is a price floor where buying pressure is strong enough to prevent the price from falling further. A resistance level is a price ceiling where selling pressure is sufficient to stop the price from rising higher.
Candlestick Patterns
Candlestick charts are a primary tool for price action traders. Each candlestick represents a specific period and shows the open, high, low, and closing prices. The shape and color of the candlesticks form patterns (e.g., Doji, Hammer, Engulfing) that provide insights into market sentiment and can signal potential reversals or continuations.
Trend Analysis
Price action traders identify the market’s trend by observing the sequence of highs and lows. An uptrend is characterized by a series of higher highs and higher lows, while a downtrend is marked by lower highs and lower lows. A break in this sequence can indicate a potential trend reversal.
Add Your Heading Text Here
Price action is a trading methodology that analyzes the movement of an asset’s price over time to make trading decisions. It is the foundation of technical analysis and operates on the principle that all relevant market information—including economic news, investor sentiment, and fundamental data—is already reflected in the asset’s price.
Instead of relying on lagging technical indicators, traders who use price action focus on a “naked” or clean chart. By observing historical price data, they identify patterns, trends, and key levels to predict future price direction.The core concepts of price action analysis include:Support and Resistance
These are price levels where an asset’s price has historically paused or reversed direction. A support level is a price floor where buying pressure is strong enough to prevent the price from falling further. A resistance level is a price ceiling where selling pressure is sufficient to stop the price from rising higher.
Candlestick Patterns
Candlestick charts are a primary tool for price action traders. Each candlestick represents a specific period and shows the open, high, low, and closing prices. The shape and color of the candlesticks form patterns (e.g., Doji, Hammer, Engulfing) that provide insights into market sentiment and can signal potential reversals or continuations.
Trend Analysis
Price action traders identify the market’s trend by observing the sequence of highs and lows. An uptrend is characterized by a series of higher highs and higher lows, while a downtrend is marked by lower highs and lower lows. A break in this sequence can indicate a potential trend reversal.
Price Action: From Chaos to Clarity