eBook Author

Pinbar Entry

Pinbar Entry

“Pinbar”

refers to the narrative or sequence of events that the price movement of a financial asset tells over a specific period, as depicted visually on a chart.

It’s an interpretive way of understanding market dynamics by observing:

  1. Who’s in control: Are buyers (bulls) dominant, driving prices up? Or are sellers (bears) in charge, pushing prices down?

  2. Key turning points: Where did the sentiment shift? Where did prices reverse, consolidate, or accelerate

  1. Is the current trend bullish or bearish?

2. Is the main trend bullish or bearish on selected timeframe?

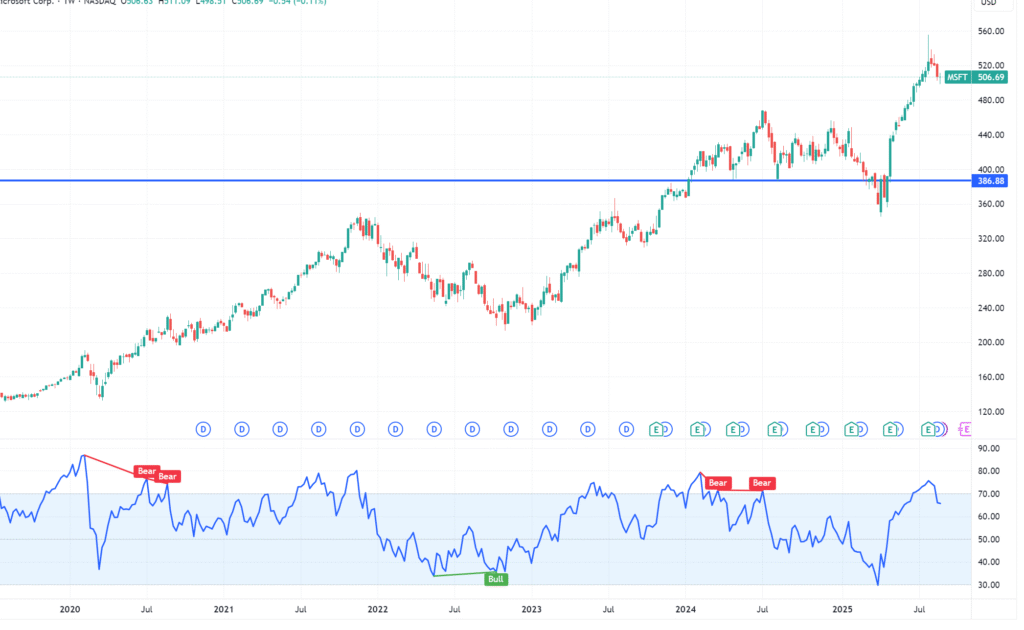
3. Where is price now? where are the keylevels?

4. Are there any Price Action?

5. Are there any failed Price Action?

6. Is there evidence that the market is getting rid of buyers or sellers?

💰“The Power of the Trends”

Quotes:

  1. “Let Price Tell the Story.”

  2. “Price Never Lies – Everything Else Might.”

  3. “Trade What You See, Not What You Think.”

  4. “Candles Speak Louder Than Indicators.”

  5. “The Truth is in the Candles.”


The Golden Rule: Have a Plan Before You Enter!

No matter which method you choose, the most crucial aspect of taking profit is to define your take-profit point before you enter the trade. This prevents emotional decisions and ensures you’re trading with discipline. It’s part of your “best setup” plan!

“Pinbar at Support”

In the dynamic world of financial trading, key levels are the unsung heroes of technical analysis. Think of them as crucial lines in the sand on a price chart – specific price points where an asset’s value 

“Pinbar at Resistance”

In the dynamic world of financial trading, key levels are the unsung heroes of technical analysis. Think of them as crucial lines in the sand on a price chart – specific price points where an asset’s value 

“Pinbar in a Trend”

In the dynamic world of financial trading, key levels are the unsung heroes of technical analysis. Think of them as crucial lines in the sand on a price chart – specific price points where an asset’s value 

“Pinbar at KeyLevel”

In the dynamic world of financial trading, key levels are the unsung heroes of technical analysis. Think of them as crucial lines in the sand on a price chart – specific price points where an asset’s value 

   2.“The Story of Filtering the Markets”

In the dynamic world of financial trading, key levels are the unsung heroes of technical analysis. Think of them as crucial lines in the sand on a price chart – specific price points where an asset’s value has historically shown significant reaction. Whether acting as support (a floor preventing further falls) or resistance (a ceiling preventing further rises), these levels are where supply and demand typically battle it out. Understanding them is fundamental, as they offer traders powerful insights into potential price reversals, continuations, and strategic points for entering or exiting trades.