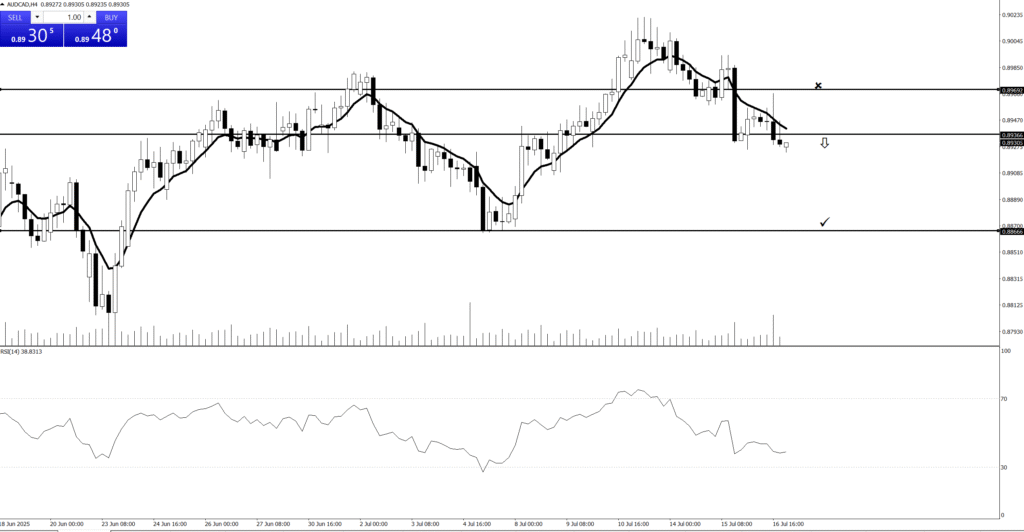
Swing Trading
💰
“Enter the trade — then sit on your hands like a monk!”
“We don’t click and panic. We click and chill.”
“Traders who wait, get paid. Traders who fidget… donate!”
“We enter the trade, then do absolutely nothing like pros.”
“Let the market work. You’re not its boss.”
Lorem ipsum dolor sit amet, consectetur adipiscing elit. Ut elit tellus, luctus nec ullamcorper mattis, pulvinar dapibus leo.
💰
Price action is the foundation of technical trading. It refers to the movement of price over time, without relying on indicators. Here’s why it’s powerful:
🔥 The Power of Price Action:
Simplicity
Price action strips away distractions. Traders read candles, structure, and key levels directly from the chart.Real-Time Clarity
It reflects real-time decisions of buyers and sellers, showing where the market is reacting.Universal Application
Works on all timeframes and markets—forex, stocks, crypto.Identifies Key Setups
Patterns like:Pin bars
Engulfing candles
Inside bars
Break and retest
provide high-probability entries.
Institutional Footprints
Price action helps you “see” what smart money is doing—entries at key levels, liquidity grabs, false breaks, etc.No Lag
Unlike indicators, it’s immediate—based on what’s happening now, not 10 bars ago.
💰
“Enter the trade — then sit on your hands like a monk!”
“We don’t click and panic. We click and chill.”
“Traders who wait, get paid. Traders who fidget… donate!”
“We enter the trade, then do absolutely nothing like pros.”
“Let the market work. You’re not its boss.”
💰
“Enter the trade — then sit on your hands like a monk!”
“We don’t click and panic. We click and chill.”
“Traders who wait, get paid. Traders who fidget… donate!”
“We enter the trade, then do absolutely nothing like pros.”
“Let the market work. You’re not its boss.”
The Story of the Chart
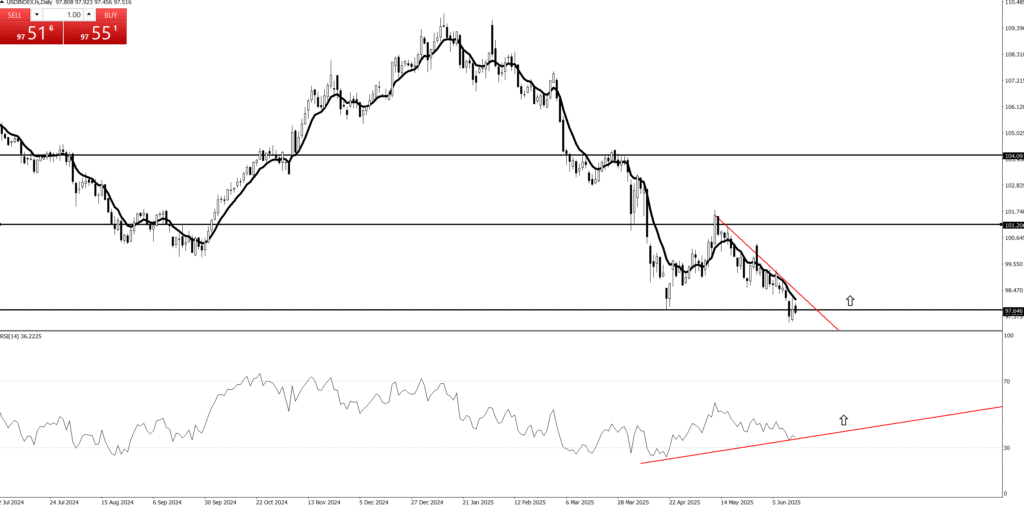
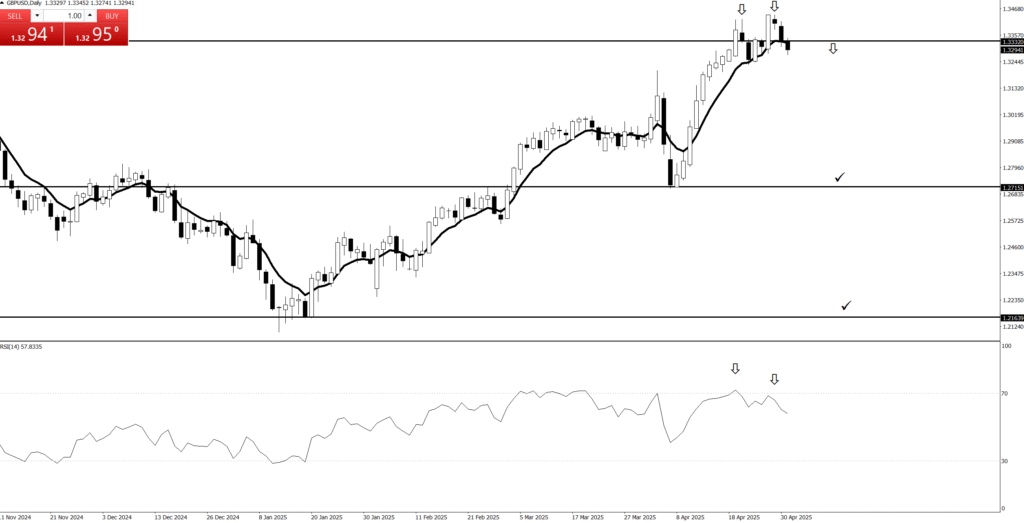
- Is the current trend bullish or bearish?
2. Is the main trend bullish or bearish on selected timeframe?
3. Where is price now? where are the keylevels?
4. Are there any Price Action?
5. Are there any failed Price Action?
6. Is there evidence that the market is getting rid of buyers or sellers?
💰“The Power of Price Action”
Quotes:
“Let Price Tell the Story.”
“Price Never Lies – Everything Else Might.”
“Trade What You See, Not What You Think.”
“Candles Speak Louder Than Indicators.”
- “The Truth is in the Candles.”
“The story of the price action chart”
refers to the narrative or sequence of events that the price movement of a financial asset tells over a specific period, as depicted visually on a chart.
It’s an interpretive way of understanding market dynamics by observing:
Who’s in control: Are buyers (bulls) dominant, driving prices up? Or are sellers (bears) in charge, pushing prices down?
Key turning points: Where did the sentiment shift? Where did prices reverse, consolidate, or accelerate?
Areas of strength and weakness: At what price levels did the asset find support (a floor) or resistance (a ceiling)?
Market psychology: The patterns formed by the candlesticks (or bars) and their wicks (shadows) reflect the collective emotions and decisions of market participants—fear, greed, indecision, conviction, and panic.
Instead of relying on mathematical indicators (like moving averages, RSI, MACD) to filter or interpret the price, price action analysis focuses on the raw price data itself. Each candlestick (or bar) is seen as a “message” from the market, telling you what happened during that specific time interval (e.g., 5 minutes, 1 hour, 1 day).
So, when someone asks for “the story of the price action chart,” they’re asking for:
A historical account: What has the price done?
An analysis of supply and demand: Where did buyers step in? Where did sellers dominate?
Identification of patterns: Are there recurring shapes or behaviors that suggest future possibilities?
A qualitative understanding: Beyond just numbers, what does the visual pattern feel like in terms of market sentiment?
In essence, it’s about reading the chart directly, like a book, to understand the market’s past behavior and infer its potential future trajectory based on pure price movements.
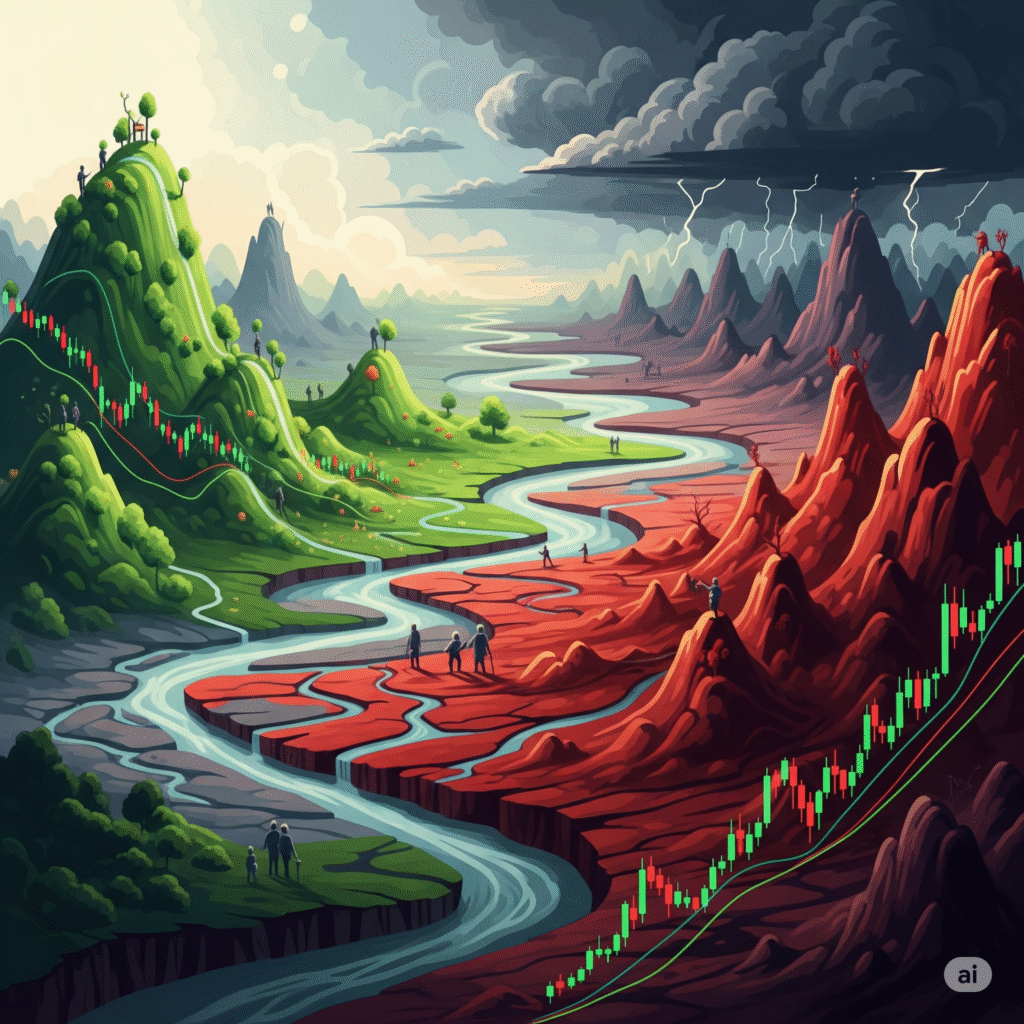
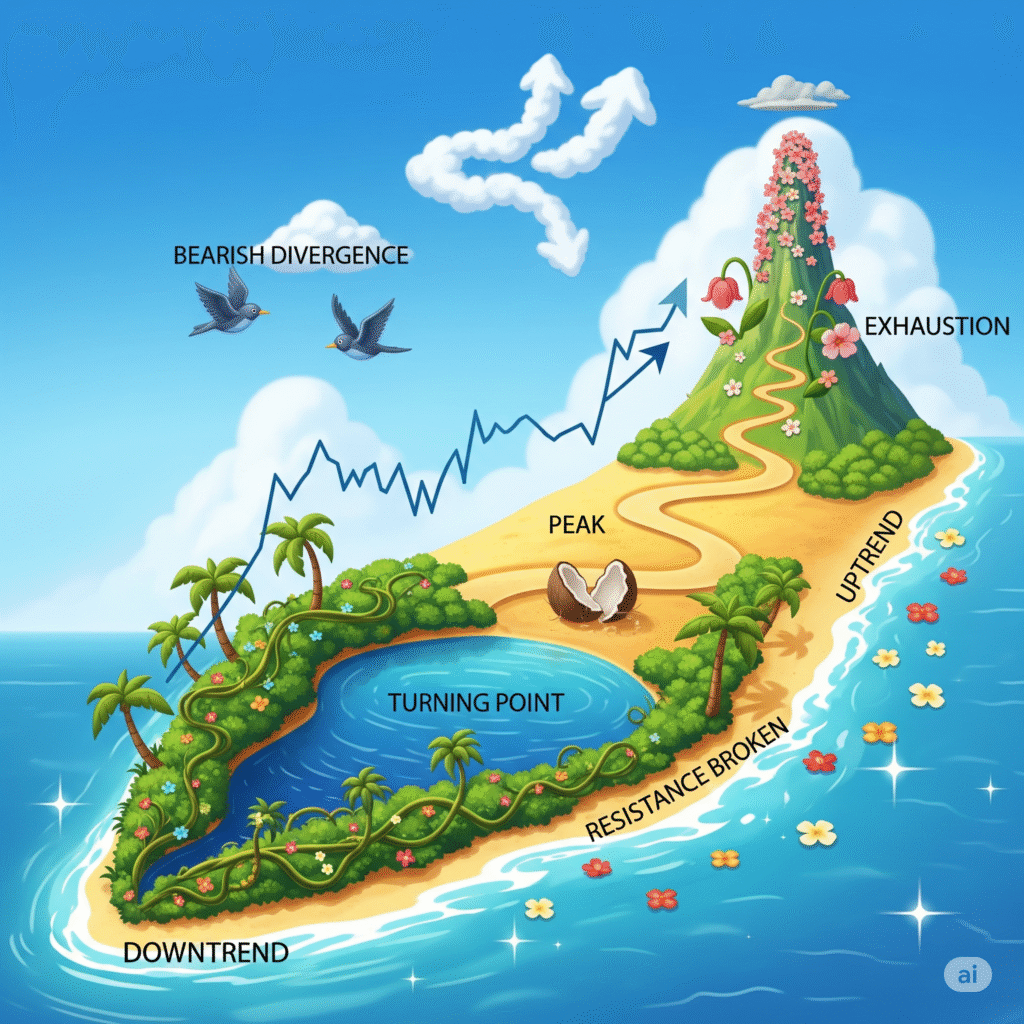
Trading Charts: Your Market Decoder Ring (and Reality Show!)
Ever stare at a bunch of flickering numbers and think, “There has to be a better way to understand this chaos?” Well, my friend, say hello to Trading Charts!
These aren’t just fancy graphs; they’re the market’s own reality show, condensed into a visual story. Each bar or candlestick is a tiny drama playing out, showing you exactly where the price opened, closed, and briefly went crazy, all over a specific period.
Think of it as your personal decoder ring for the financial world. Instead of trying to guess what’s happening, you’re literally seeing the market’s past behavior laid out before you. Are prices skyrocketing like a cat on a trampoline? Or are they plummeting like a lead balloon? Your chart tells all!
So, grab your popcorn. By learning to read these visual diaries, you’ll start spotting patterns, understanding the market’s moods, and maybe even predicting its next dramatic plot twist. It’s less guesswork, more “aha!” moments.
