Price Action: Read the Chart, Skip the Financial Novel!
Tired of listening to endless financial news and confusing analysts? Throw out the complicated economic novels! The most successful traders know the chart itself is telling a high-stakes, exciting, and profitable story—and it’s called Price Action Trading.
The candles aren’t just colored blocks; they are characters in a drama, constantly revealing the emotional battle between the confident buyers (bulls) and the desperate sellers (bears). Your job is to read the clues and predict the final act!
The Power of the Visual Narrative
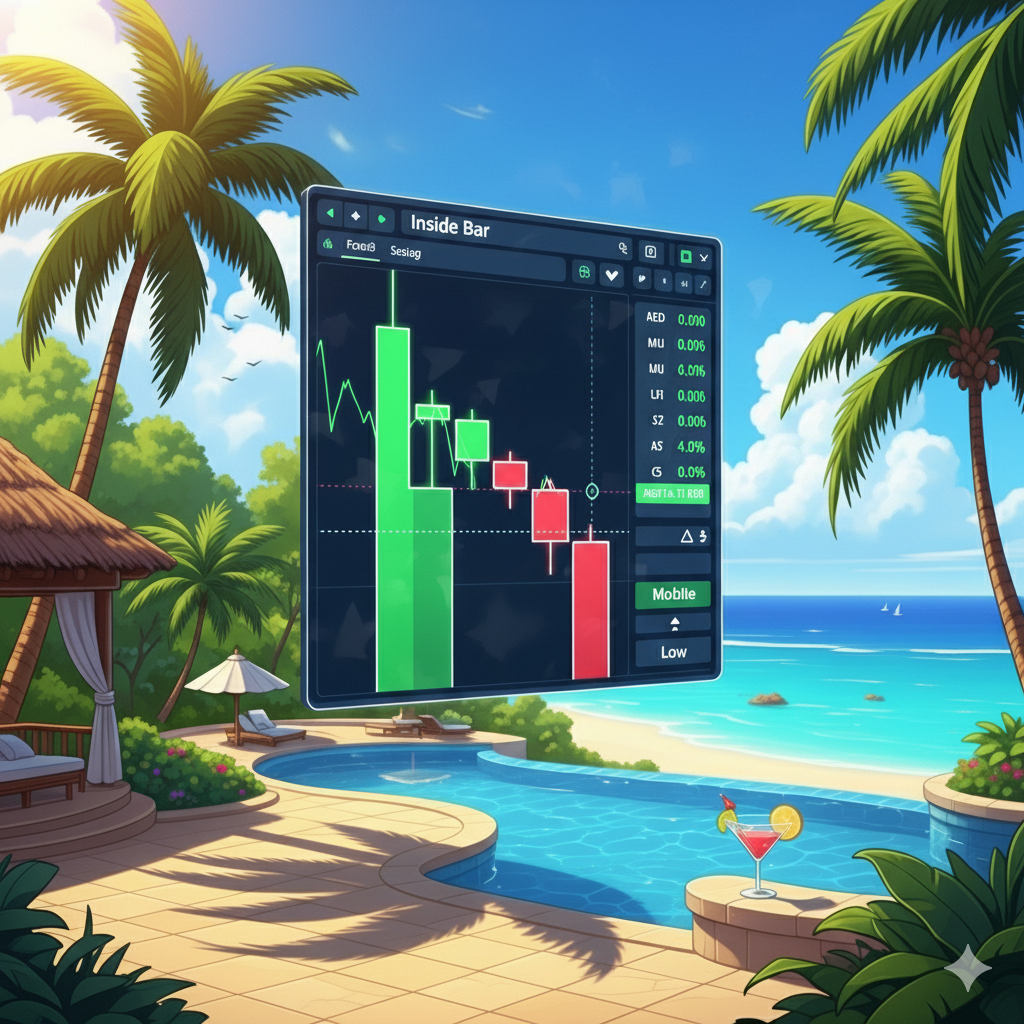
Candles as Confessions: Each candle is a direct confession of market behavior for that period. A large, full-bodied green candle isn’t just a price move; it’s the buyers delivering a beat-down to the sellers! A long wick shows where a side tried to go but spectacularly failed—a massive sign of rejection and a clue about the next move.
Levels as Battlegrounds: Key Support and Resistance levels aren’t arbitrary lines; they are confirmed, historical battlegrounds. When the price hits an established level, the chart is telling you: “A decisive fight is about to break out right here!” You watch for the price action at that level—the bounce or the break—to tell you who won the war.
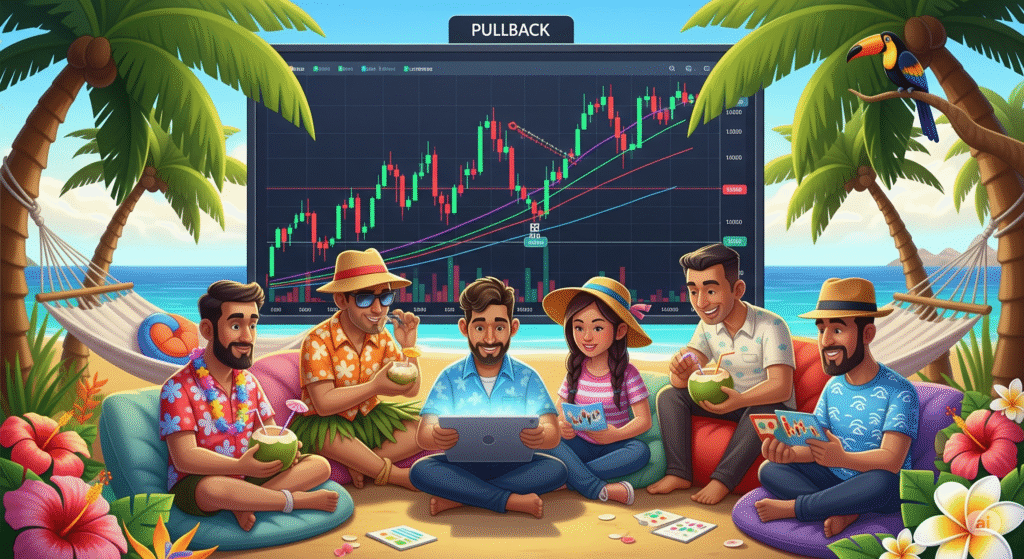
Patterns as Plot Twists: Price patterns (like a clear head and shoulders or a simple continuation triangle) are the chart’s plot twists. They signal a collective shift in market sentiment, revealing the likely direction of the next major move. You don’t need indicators to predict the outcome; the characters (the price bars) have already revealed the climax!
Trading the Drama, Ignoring the Noise
The beauty of Price Action is its simplicity. It strips away all the confusing, lagging indicators and external noise, forcing you to focus on the pure, raw truth: What is the price doing right now, and why?
By learning to read the story told by the wicks (rejection!), the bodies (conviction!), and the key levels (the battle!), you gain a massive advantage. You stop reacting to market gossip and start trading the verified, unfolding narrative. Read the chart’s story, and let its drama become your profitable reality!