The Architect’s Blueprint: Market Structure
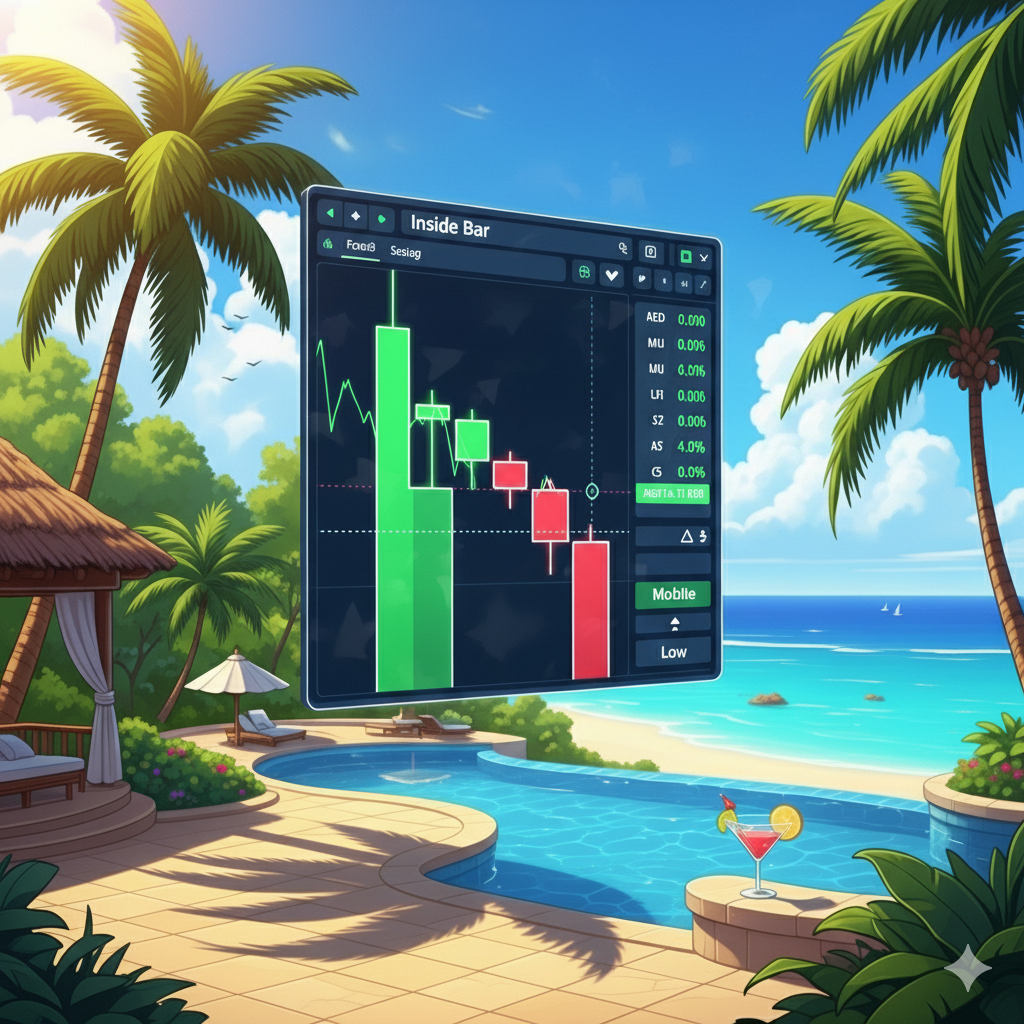
Chip was hunched over the screen, looking stressed. “Ollie, I’m seeing conflicting signals on Quantum Quinoa (QQ). The 5-minute chart is showing a bearish divergence, but the 15-minute chart just printed a textbook bullish engulfing. What do I trade? It’s chaos!”
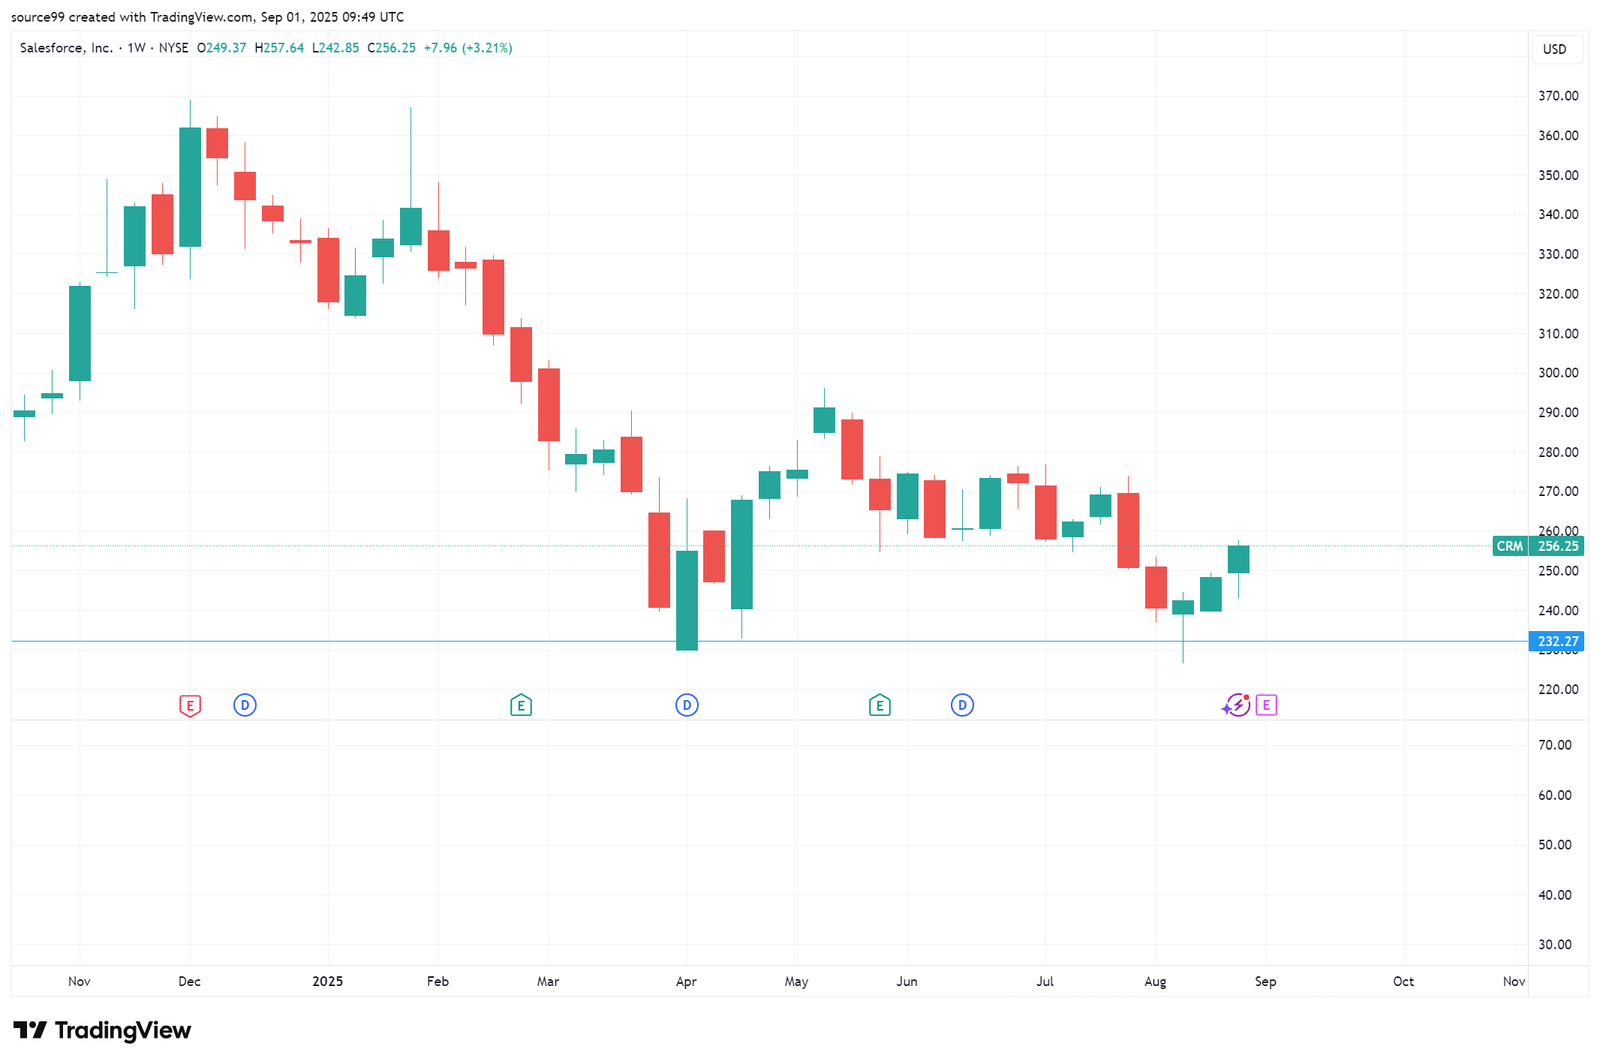
Ollie, who was casually sipping an artisanal juice, leaned over and pinched the screen, zooming the chart out from the frantic 15-minute view to the calm, sprawling Daily timeframe. The price action, which had seemed like a confusing mess of zig-zags, now snapped into a crystal-clear image.
“You’re arguing about the traffic at one intersection, Chip, when the entire city is driving uphill,” Ollie observed, a hint of professional amusement in his voice. “You’re so focused on the flavor of a single potato chip that you’re missing the fact that we’re at a five-star buffet.”
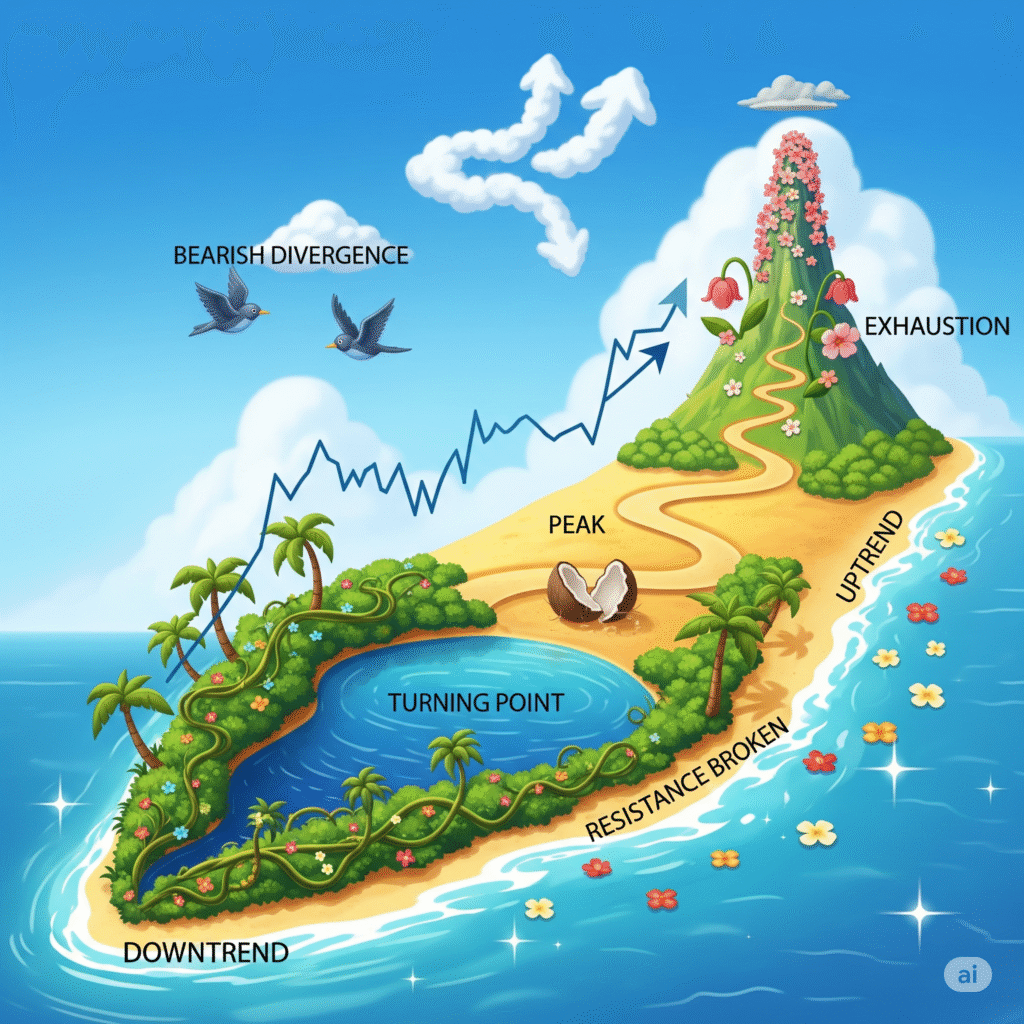
Chip stared at the zoomed-out chart. It was undeniable. For months, QQ had been methodically climbing, painting a beautiful staircase of Higher Highs (HH) and Higher Lows (HL).
“This is the Overall Market Condition, Chip. We call it Market Structure,” Ollie explained, tapping the screen. “Every day trader with a twitchy finger is trying to guess what happens next. But we, the professionals, simply ask, ‘What is the main party doing?’ And the main party, on this chart, is throwing an Uptrend.”
Ollie then pointed to two distinct possibilities:
Uptrend: Clearly visible HHs and HLs. The only trades we take are longs (buys).
Sideways (Range): Price trapped horizontally between two Key Levels. We only scalp the edges or wait for a breakout.
“Your 5-minute bearish signal was simply a car changing lanes, but the highway is still heading North,” Ollie concluded. “When the structure is clearly an Uptrend, all bearish signals are noise, and every significant pullback is a discounted entry opportunity. Our job isn’t to fight the current; it’s to find the cleanest, safest place to jump in.”
Chip immediately trashed his bearish trade plan. He marked the most recent Higher Low and placed a buy limit order, realizing that the simplest truth on the chart—the direction of the main trend—was the most exciting and profitable signal of all. He was finally seeing the forest, not just the leaves.