The Oracle of Obvious: Spotting Simplicity
Ollie “The Oracle of Obvious” believed trading was essentially a high-stakes game of “Follow the Bouncing Ball.” His partner, Chip, however, preferred a high-stakes game of “How Many Indicators Can I Stack on This Chart Until It Crashes?” Professionally, Ollie was focused on price action fundamentals; humorously, Chip’s screen looked like a modern art critique of spaghetti.
Today, the asset in question was Mega-Hedge Fund (MHF). MHF was in a clear, undeniable uptrend. Chip was sweating, muttering about Bollinger Bands, stochastic oscillators, and wave counts. “The ADX is signaling divergence, but the MACD is crossing! What does it mean, Ollie? The market is sending mixed messages!”
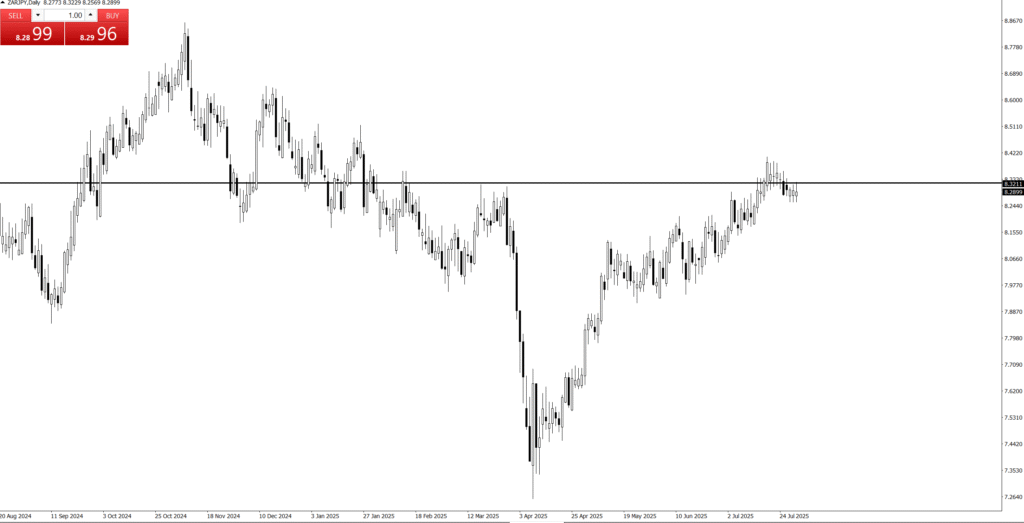
Ollie simply pointed at the chart. “Chip, look at the last five weeks. What is the lowest price MHF has failed to close below? $150. That’s not a mixed message; that’s a giant, flashing neon sign that says, ‘Buy Here.’ That $150 line is the market’s psychological foundation. It’s too obvious to ignore.”
Ollie entered a buy order right at the $150 support line. His rationale was brilliantly simple: if the market is respecting a level that clearly, institutional buyers are using it as an anchor. The Stop Loss was placed just below $150—if the obvious support failed, his trade thesis was dead, and he’d exit instantly. His Risk/Reward was stellar because his entry was precisely defined.
Chip, meanwhile, was paralyzed. He was waiting for the perfect confluence of his 17 indicators. He saw the price bounce off $150, exactly as Ollie predicted, and begin to climb. He then waited for the Stochastics to cross back above 80, the RSI to dip below 70, and a specific fractal pattern to form—all of which were just lagging confirmation of a move already in progress.
As Chip was still adjusting his indicator settings, MHF surged, fueled by the very momentum Ollie had identified from the start. Ollie was riding the wave, confident because his signal was not derived from complex calculations, but from simple, irrefutable market behavior.
Chip finally bought two days later, chasing the price higher with a terrible entry.
“The secret to trading, Chip, isn’t finding hidden wisdom,” Ollie advised, checking his massive profit. “It’s seeing what’s right in front of you and having the guts to trust it. The biggest signals are the ones everyone dismisses as ‘too easy.’ When the support is clean, the trend is obvious, and the price is right, that’s your time to act.”