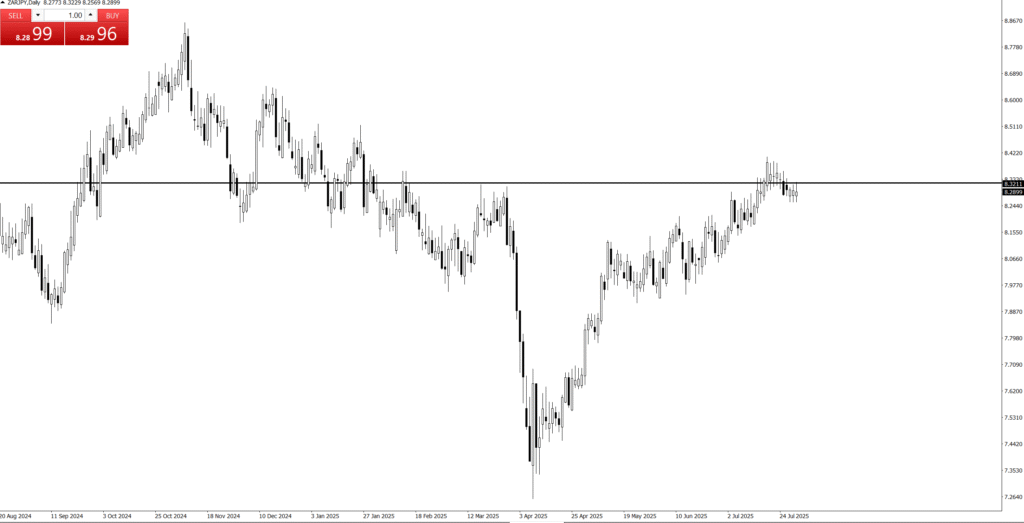
The Story of the Stop Loss


- Is the current trend bullish or bearish?
2. Is the main trend bullish or bearish on selected timeframe?
3. Where is price now? where are the keylevels?
4. Are there any Price Action?
5. Are there any failed Price Action?
6. Is there evidence that the market is getting rid of buyers or sellers?
💰“The Power of Price Action”
Quotes:
“Let Price Tell the Story.”
“Price Never Lies – Everything Else Might.”
“Trade What You See, Not What You Think.”
“Candles Speak Louder Than Indicators.”
- “The Truth is in the Candles.”
“The story of The Trend”
refers to the narrative or sequence of events that the price movement of a financial asset tells over a specific period, as depicted visually on a chart.
It’s an interpretive way of understanding market dynamics by observing:
Who’s in control: Are buyers (bulls) dominant, driving prices up? Or are sellers (bears) in charge, pushing prices down?
Key turning points: Where did the sentiment shift? Where did prices reverse, consolidate, or accelerate?
Areas of strength and weakness: At what price levels did the asset find support (a floor) or resistance (a ceiling)?
Market psychology: The patterns formed by the candlesticks (or bars) and their wicks (shadows) reflect the collective emotions and decisions of market participants—fear, greed, indecision, conviction, and panic.
Instead of relying on mathematical indicators (like moving averages, RSI, MACD) to filter or interpret the price, price action analysis focuses on the raw price data itself. Each candlestick (or bar) is seen as a “message” from the market, telling you what happened during that specific time interval (e.g., 5 minutes, 1 hour, 1 day).
So, when someone asks for “the story of the price action chart,” they’re asking for:
A historical account: What has the price done?
An analysis of supply and demand: Where did buyers step in? Where did sellers dominate?
Identification of patterns: Are there recurring shapes or behaviors that suggest future possibilities?
A qualitative understanding: Beyond just numbers, what does the visual pattern feel like in terms of market sentiment?
In essence, it’s about reading the chart directly, like a book, to understand the market’s past behavior and infer its potential future trajectory based on pure price movements.


4. Stop Loss

Let’s talk about the unsung hero of our trading strategy, the silent guardian, the watchful protector: the stop-loss.
Our Love-Hate Relationship with the Stop-Loss
Here at [Your Company/Team Name, or “our trading desk”], we’ve got a profound, albeit slightly complicated, relationship with the stop-loss. Think of it like that super-responsible friend who always makes sure you don’t do anything too stupid on a wild night out. You might grumble when they pull you away from that questionable decision, but you’re eternally grateful the next morning when you’re not missing an eyebrow.
That’s our stop-loss. It’s the designated driver for our trades, preventing us from driving our accounts straight into a ditch at 100 miles an hour while screaming, “It’s just a temporary dip! It’ll come back!” (Spoiler alert: it usually doesn’t, not without taking your entire portfolio with it.)
Why We Embrace the “Slightly Painful Nudge”
Some traders, bless their optimistic hearts, view a stop-loss as a personal insult, a sign of weakness, or perhaps a tiny financial guillotine. They’d rather ride a losing trade down to zero, hoping for a miraculous turnaround, like waiting for a flat tire to reinflate itself through sheer willpower.
Not us. We’ve learned that a small, controlled loss is like a tiny paper cut compared to the gaping financial wound of a blown-up account. When our stop-loss gets hit, it’s not a defeat; it’s the market gently (or sometimes firmly) nudging us with a sticky note that says, “Hey, genius, your idea was wrong. Time to exit and rethink your life choices… or at least your next trade.”
The Unspoken Benefits of Our Stop-Loss Obsession
Sleep: Believe it or not, knowing your downside is capped lets you actually close your eyes at night without visions of red numbers dancing in your head. It’s truly revolutionary.
Sanity: Less emotional attachment to a dying trade means fewer arguments with your spouse about why you’re glued to the screen muttering about “support levels.”
Capital Preservation: This is fancy talk for “not losing all your money.” Our stop-loss is like a tiny, vigilant bodyguard for our trading capital, always ready to step in and say, “Alright, that’s enough fun for today.”
The Freedom to Be Wrong (Often!): Since we accept small losses, we’re not afraid to try new things. We know that if a trade goes sideways, our trusty stop-loss will catch us before we fall into the abyss of regret.
So, yes, we use stop-losses. Not because we’re pessimists, but because we’re realists who prefer controlled exits over catastrophic explosions. And honestly, it leaves us with more money for coffee and other vital trading supplies
💰Quotes:
“Enter the trade — then sit on your hands like a monk!”
“We don’t click and panic. We click and chill.”
“Traders who wait, get paid. Traders who fidget… donate!”
“We enter the trade, then do absolutely nothing like pros.”
“Let the market work. You’re not its boss.”
💰Normal Tone Slogans:
“Enter with a plan, then let the trade play out.”
“The work is in the setup — the result comes with patience.”
“We don’t babysit trades. We trust our edge.”
“Entry is action. Waiting is discipline.”
“After entry, emotion has no place — only patience.”
