The Story of the Trend


- Is the current trend bullish or bearish?
2. Is the main trend bullish or bearish on selected timeframe?
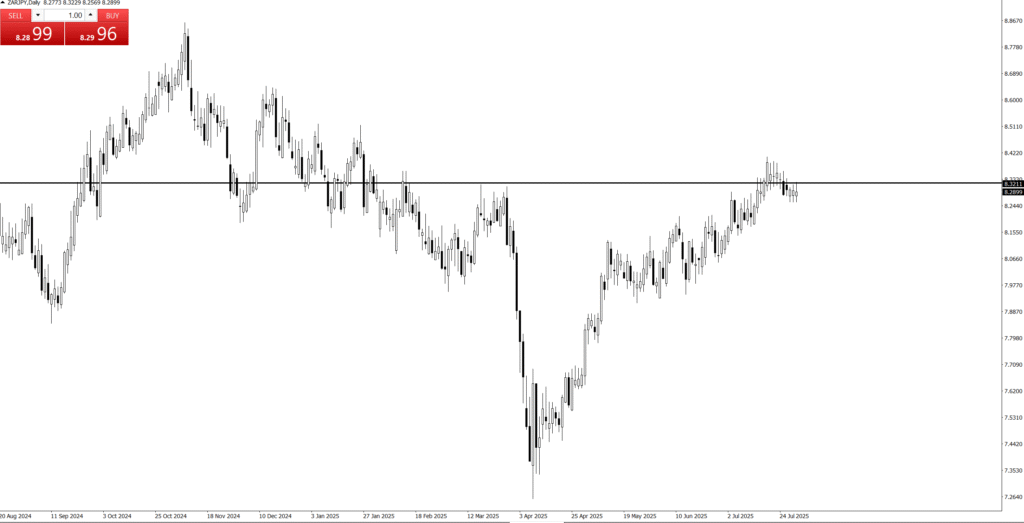
3. Where is price now? where are the keylevels?
4. Are there any Price Action?
5. Are there any failed Price Action?
6. Is there evidence that the market is getting rid of buyers or sellers?
💰“The Power of Price Action”
Quotes:
“Let Price Tell the Story.”
“Price Never Lies – Everything Else Might.”
“Trade What You See, Not What You Think.”
“Candles Speak Louder Than Indicators.”
- “The Truth is in the Candles.”
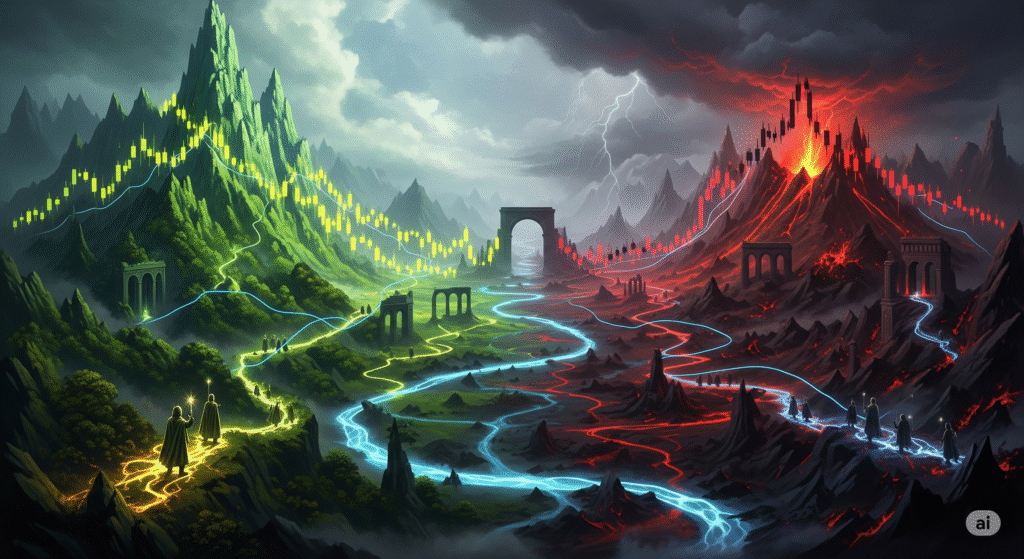
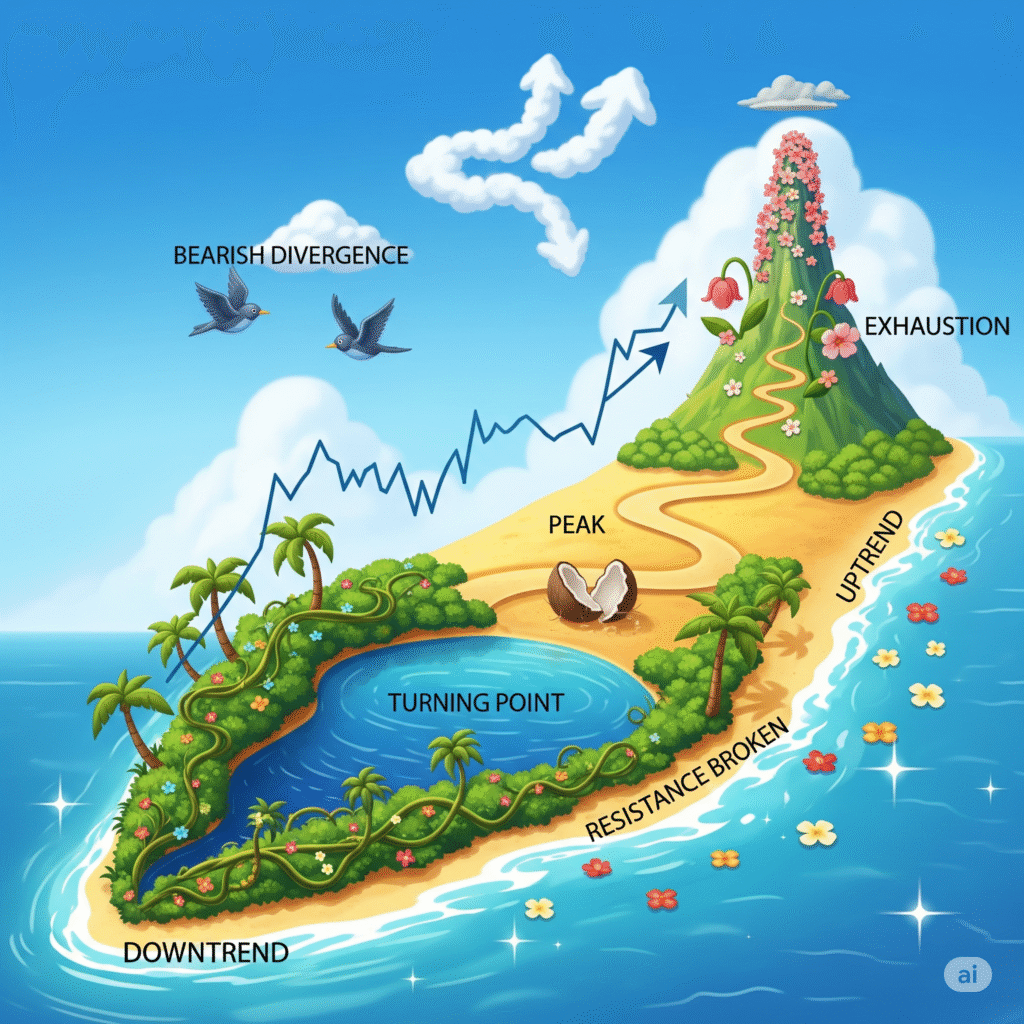
“The story of The Trend”
refers to the narrative or sequence of events that the price movement of a financial asset tells over a specific period, as depicted visually on a chart.
It’s an interpretive way of understanding market dynamics by observing:
Who’s in control: Are buyers (bulls) dominant, driving prices up? Or are sellers (bears) in charge, pushing prices down?
Key turning points: Where did the sentiment shift? Where did prices reverse, consolidate, or accelerate?
Areas of strength and weakness: At what price levels did the asset find support (a floor) or resistance (a ceiling)?
Market psychology: The patterns formed by the candlesticks (or bars) and their wicks (shadows) reflect the collective emotions and decisions of market participants—fear, greed, indecision, conviction, and panic.
Instead of relying on mathematical indicators (like moving averages, RSI, MACD) to filter or interpret the price, price action analysis focuses on the raw price data itself. Each candlestick (or bar) is seen as a “message” from the market, telling you what happened during that specific time interval (e.g., 5 minutes, 1 hour, 1 day).
So, when someone asks for “the story of the price action chart,” they’re asking for:
A historical account: What has the price done?
An analysis of supply and demand: Where did buyers step in? Where did sellers dominate?
Identification of patterns: Are there recurring shapes or behaviors that suggest future possibilities?
A qualitative understanding: Beyond just numbers, what does the visual pattern feel like in terms of market sentiment?
In essence, it’s about reading the chart directly, like a book, to understand the market’s past behavior and infer its potential future trajectory based on pure price movements.

