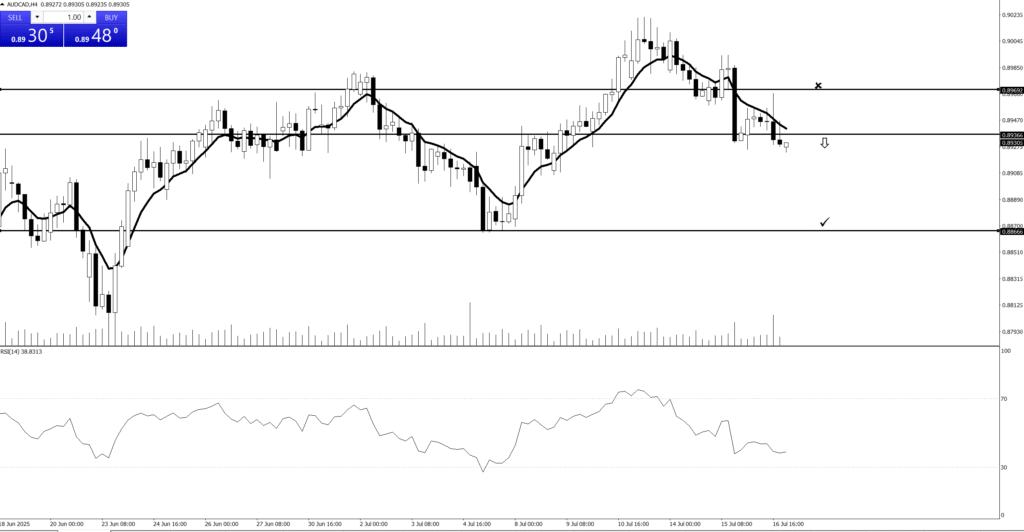
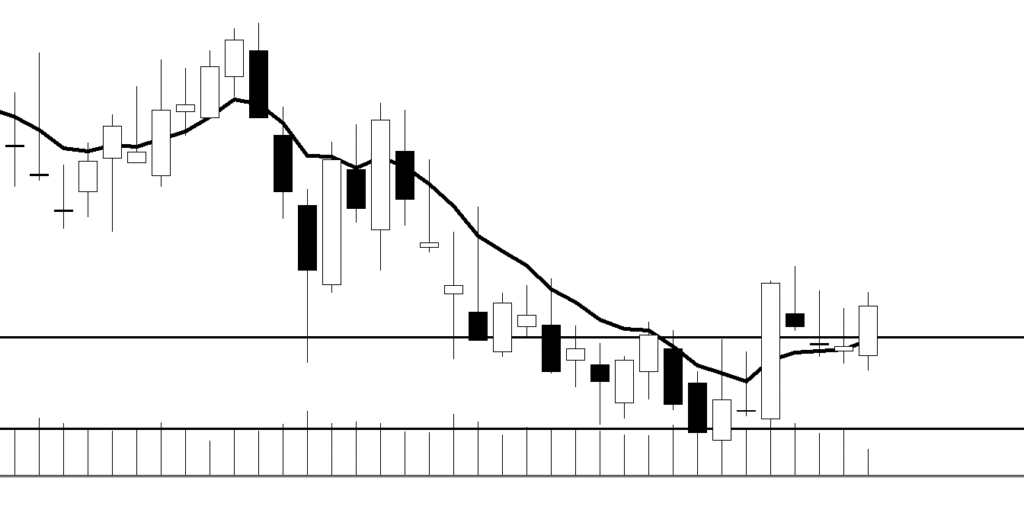
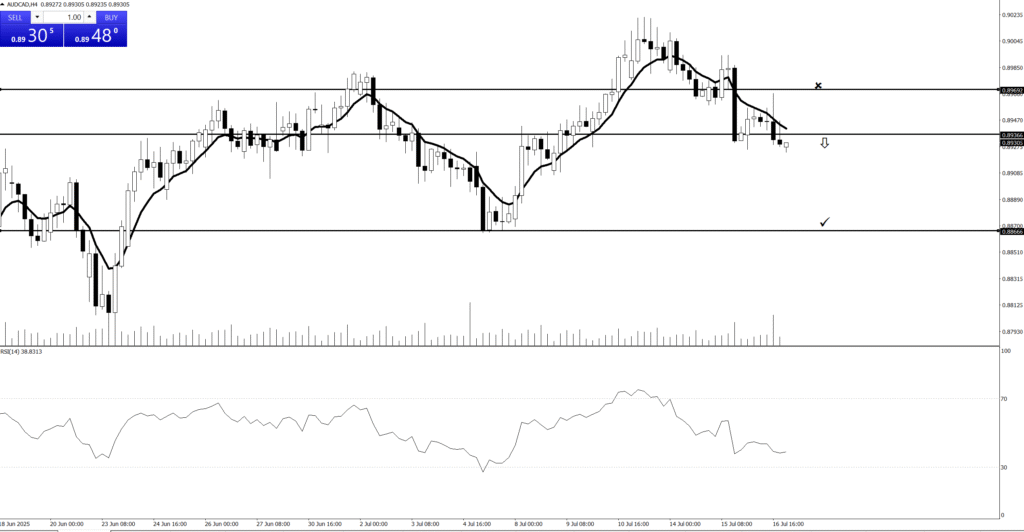
A Pin Bar entry in trading refers to a setup based on a candlestick pattern that signals a potential reversal in price. The term “Pin Bar” is short for “Pinocchio Bar”, named for its long “nose” that lies about market direction — suggesting a false move in one direction before reversing.


🔹 2. Inside Bar (Sell Setup)
Context: Occurs at resistance or after an uptrend.
Pin Bar Shape: Long upper tail, small real body near the bottom.
Entry: Sell on break below the low of the pin bar.
Stop Loss: Above the high of the pin bar.
Take Profit: Near support or via R:R ratio.

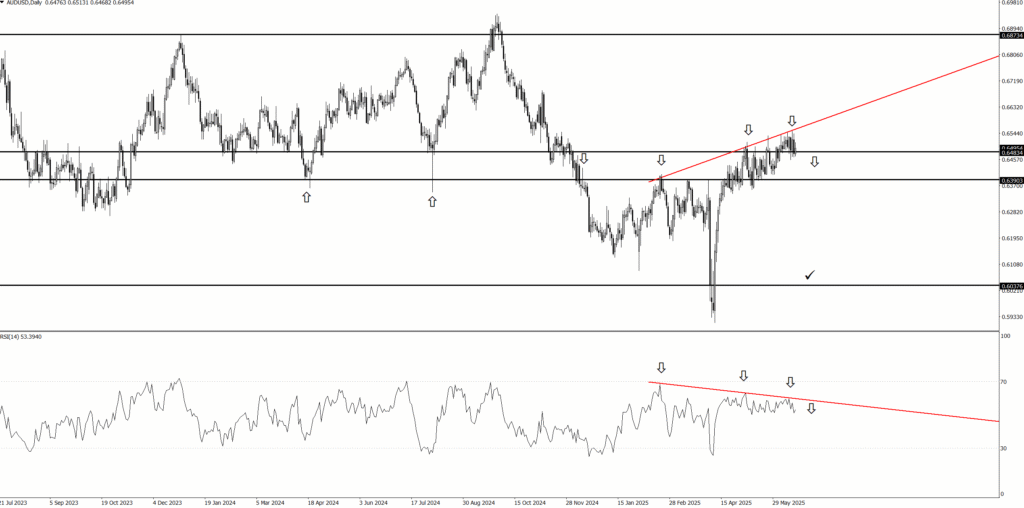
🔹 3. False Break (Sell Setup)
Context: Occurs at resistance or after an uptrend.
Pin Bar Shape: Long upper tail, small real body near the bottom.
Entry: Sell on break below the low of the pin bar.
Stop Loss: Above the high of the pin bar.
Take Profit: Near support or via R:R ratio.

🔹 4. Pinbar (Sell Setup)
-
Context: Occurs at resistance or after an uptrend.
-
Pin Bar Shape: Long upper tail, small real body near the bottom.
-
Entry: Sell on break below the low of the pin bar.
-
Stop Loss: Above the high of the pin bar.
-
Take Profit: Near support or via R:R ratio.

🔧 Tips for Effective Pin Bar Trading
Trade with trend for higher probability.
Use with support/resistance, Fibonacci, or moving averages.
Avoid trading pin bars in choppy or low-volume conditions.
Look for strong rejection candles with good context — not just any long wick.

Price Action
💰
“Enter the trade — then sit on your hands like a monk!”
“We don’t click and panic. We click and chill.”
“Traders who wait, get paid. Traders who fidget… donate!”
“We enter the trade, then do absolutely nothing like pros.”
“Let the market work. You’re not its boss.”
Lorem ipsum dolor sit amet, consectetur adipiscing elit. Ut elit tellus, luctus nec ullamcorper mattis, pulvinar dapibus leo.
💰
Price action is the foundation of technical trading. It refers to the movement of price over time, without relying on indicators. Here’s why it’s powerful:
🔥 The Power of Price Action:
Simplicity
Price action strips away distractions. Traders read candles, structure, and key levels directly from the chart.Real-Time Clarity
It reflects real-time decisions of buyers and sellers, showing where the market is reacting.Universal Application
Works on all timeframes and markets—forex, stocks, crypto.Identifies Key Setups
Patterns like:Pin bars
Engulfing candles
Inside bars
Break and retest
provide high-probability entries.
Institutional Footprints
Price action helps you “see” what smart money is doing—entries at key levels, liquidity grabs, false breaks, etc.No Lag
Unlike indicators, it’s immediate—based on what’s happening now, not 10 bars ago.
💰
“Enter the trade — then sit on your hands like a monk!”
“We don’t click and panic. We click and chill.”
“Traders who wait, get paid. Traders who fidget… donate!”
“We enter the trade, then do absolutely nothing like pros.”
“Let the market work. You’re not its boss.”
💰
“Enter the trade — then sit on your hands like a monk!”
“We don’t click and panic. We click and chill.”
“Traders who wait, get paid. Traders who fidget… donate!”
“We enter the trade, then do absolutely nothing like pros.”
“Let the market work. You’re not its boss.”

Lorem ipsum dolor sit amet, consectetur adipiscing elit. Ut elit tellus, luctus nec ullamcorper mattis, pulvinar dapibus leo.
Lorem ipsum dolor sit amet, consectetur adipiscing elit. Ut elit tellus, luctus nec ullamcorper mattis, pulvinar dapibus leo.

Add Your Heading Text Here
Lorem ipsum dolor sit amet, consectetur adipiscing elit. Ut elit tellus, luctus nec ullamcorper mattis, pulvinar dapibus leo.


Lorem ipsum dolor sit amet, consectetur adipiscing elit. Ut elit tellus, luctus nec ullamcorper mattis, pulvinar dapibus leo.
Lorem ipsum dolor sit amet, consectetur adipiscing elit. Ut elit tellus, luctus nec ullamcorper mattis, pulvinar dapibus leo.

Lorem ipsum dolor sit amet, consectetur adipiscing elit. Ut elit tellus, luctus nec ullamcorper mattis, pulvinar dapibus leo.
Lorem ipsum dolor sit amet, consectetur adipiscing elit. Ut elit tellus, luctus nec ullamcorper mattis, pulvinar dapibus leo.
Lorem ipsum dolor sit amet, consectetur adipiscing elit. Ut elit tellus, luctus nec ullamcorper mattis, pulvinar dapibus leo.
Lorem ipsum dolor sit amet, consectetur adipiscing elit. Ut elit tellus, luctus nec ullamcorper mattis, pulvinar dapibus leo.
Lorem ipsum dolor sit amet, consectetur adipiscing elit. Ut elit tellus, luctus nec ullamcorper mattis, pulvinar dapibus leo.
Lorem ipsum dolor sit amet, consectetur adipiscing elit. Ut elit tellus, luctus nec ullamcorper mattis, pulvinar dapibus leo.
Lorem ipsum dolor sit amet, consectetur adipiscing elit. Ut elit tellus, luctus nec ullamcorper mattis, pulvinar dapibus leo.
Lorem ipsum dolor sit amet, consectetur adipiscing elit. Ut elit tellus, luctus nec ullamcorper mattis, pulvinar dapibus leo.

Lorem ipsum dolor sit amet, consectetur adipiscing elit. Ut elit tellus, luctus nec ullamcorper mattis, pulvinar dapibus leo.
Lorem ipsum dolor sit amet, consectetur adipiscing elit. Ut elit tellus, luctus nec ullamcorper mattis, pulvinar dapibus leo.

Our Trading Place
Calm And Collected
Lorem ipsum dolor sit amet, consectetur adipiscing elit. Ut elit tellus, luctus nec ullamcorper mattis, pulvinar dapibus leo.


Lorem ipsum dolor sit amet, consectetur adipiscing elit. Ut elit tellus, luctus nec ullamcorper mattis, pulvinar dapibus leo.
Lorem ipsum dolor sit amet, consectetur adipiscing elit. Ut elit tellus, luctus nec ullamcorper mattis, pulvinar dapibus leo.

“Calm trading means consistent charts.”
“Same chart, same story — less confusion, more clarity.”
“Timeframe hopping creates
Lorem ipsum dolor sit amet, consectetur adipiscing elit. Ut elit tellus, luctus nec ullamcorper mattis, pulvinar dapibus leo.


Lorem ipsum dolor sit amet, consectetur adipiscing elit. Ut elit tellus, luctus nec ullamcorper mattis, pulvinar dapibus leo.
Lorem ipsum dolor sit amet, consectetur adipiscing elit. Ut elit tellus, luctus nec ullamcorper mattis, pulvinar dapibus leo.

Our Trading Place
Calm And Collected
Lorem ipsum dolor sit amet, consectetur adipiscing elit. Ut elit tellus, luctus nec ullamcorper mattis, pulvinar dapibus leo.


Lorem ipsum dolor sit amet, consectetur adipiscing elit. Ut elit tellus, luctus nec ullamcorper mattis, pulvinar dapibus leo.
Lorem ipsum dolor sit amet, consectetur adipiscing elit. Ut elit tellus, luctus nec ullamcorper mattis, pulvinar dapibus leo.

“Calm trading means consistent charts.”
“Same chart, same story — less confusion, more clarity.”
“Timeframe hopping creates
Lorem ipsum dolor sit amet, consectetur adipiscing elit. Ut elit tellus, luctus nec ullamcorper mattis, pulvinar dapibus leo.

- Is the current trend bullish or bearish?
2. Is the main trend bullish or bearish on selected timeframe?
3. Where is price now? where are the keylevels?
4. Are there any Price Action?
5. Are there any failed Price Action?
6. Is there evidence that the market is getting rid of buyers or sellers?
The Golden Rule: Have a Plan Before You Enter!
No matter which method you choose, the most crucial aspect of taking profit is to define your take-profit point before you enter the trade. This prevents emotional decisions and ensures you’re trading with discipline. It’s part of your “best setup” plan!
6. Risk/Reward (rr)
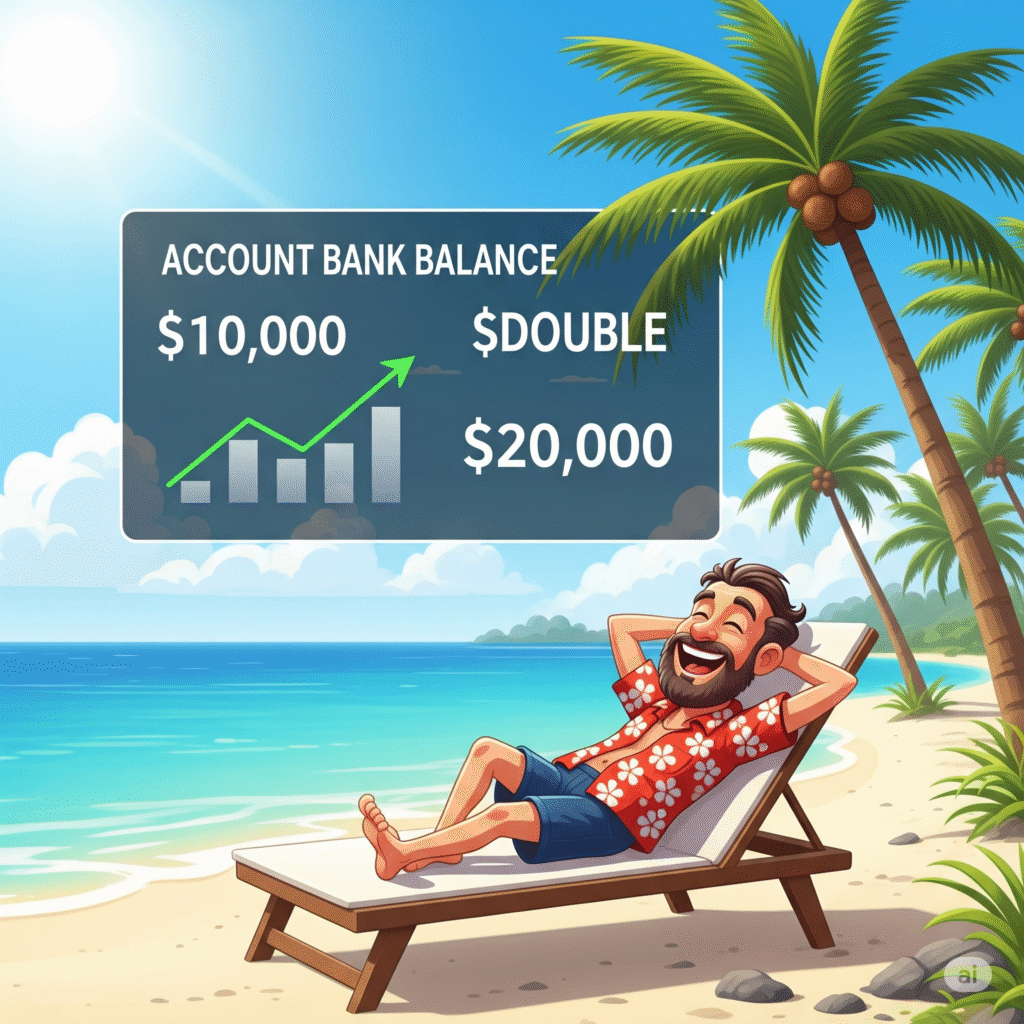
To double an account from $10,000 to $20,000 with a 5% risk per trade and different risk-reward ratios (1:2 and 1:3), we need to consider the number of winning trades required.
Here’s how to calculate it:
Initial Account Balance: $10,000 Target Account Balance: $20,000 Risk per Trade: 5% of account balance
1. Calculate the Risk Amount per Trade: The dollar amount risked per trade will change as the account balance grows.
2. Number of Doubling Periods (for a rough estimate): To go from $10,000 to $20,000 is one doubling.
3. Analyze with Different Risk-Reward Ratios:
Scenario A: Risk-Reward Ratio 1:2
Meaning: For every $1 risked, you aim to gain $2.
Win Rate for Break-Even: With a 1:2 risk-reward, you need to win at least 33.33% of your trades to break even (1 win for every 2 losses).
Profit per Winning Trade (as a percentage of risk): If you risk 5%, a 1:2 win means you gain 10% of the risked amount.
Approximate Number of Trades: This is where it gets more complex due to compounding. We’re not looking for a specific number of trades to reach a fixed percentage gain, but rather to double the account.
Let’s approach this from the perspective of overall percentage gain needed. To double your account, you need a 100% return on your initial $10,000.
Using the concept of “R-multiples”: If your risk is 1R, and your reward is 2R, then each winning trade nets you 2R. To make $10,000 profit from an initial $10,000, you need to gain $10,000. If 1R = 5% of $10,000 = $500, then 2R = $1,000. So, each winning trade (at 1:2) is approximately $1,000. You would need approximately $10,000 / $1,000 = 10 winning trades if each trade started from the initial balance.
However, since the risk amount changes with the account balance (5% of a growing balance), the profit per trade will also increase. This means you might need fewer winning trades than a simple division suggests.
Scenario B: Risk-Reward Ratio 1:3
Meaning: For every $1 risked, you aim to gain $3.
Win Rate for Break-Even: With a 1:3 risk-reward, you need to win at least 25% of your trades to break even (1 win for every 3 losses).
Profit per Winning Trade (as a percentage of risk): If you risk 5%, a 1:3 win means you gain 15% of the risked amount.
Approximate Number of Trades: If 1R = $500, then 3R = $1,500. You would need approximately $10,000 / $1,500 = 6.67 winning trades if each trade started from the initial balance. Again, with compounding, this number could be slightly lower.
Important Considerations and Nuances:
Compounding: As your account grows, 5% of the new balance is a larger dollar amount. This means each subsequent winning trade (if you maintain the 5% risk) will yield a higher dollar profit, accelerating your progress towards the $20,000 goal.
Losses: The above calculations assume only winning trades or a perfect sequence of wins. In reality, you will experience losses.
Win Rate: Your actual win rate is crucial. A higher win rate will get you to your goal faster.
Drawdowns: Even with a profitable system, you will experience drawdowns (periods where your account balance decreases). Managing these is key to reaching your target.
Trade Frequency: How often you trade will affect the time it takes to reach your goal.
Trading Strategy: The effectiveness of your trading strategy in identifying high-probability trades with your desired risk-reward ratio is paramount.
In summary, to double your account from $10,000 to $20,000 with a 5% risk per trade:
With a 1:2 Risk-Reward Ratio: You would likely need around 6 to 10 net winning trades, depending on the sequence of wins and losses and the effect of compounding.
With a 1:3 Risk-Reward Ratio: You would likely need around 4 to 7 net winning trades, again, depending on the sequence and compounding.
These are estimations. The actual number of trades will depend on your specific trading performance, including your win rate and the sequence of your wins and losses. It’s more about the accumulated R-multiples (R=Risk per tradeProfit) needed to reach the target profit, rather than a fixed number of trades in isolation.
💰Quotes:
“Enter the trade — then sit on your hands like a monk!”
“We don’t click and panic. We click and chill.”
“Traders who wait, get paid. Traders who fidget… donate!”
“We enter the trade, then do absolutely nothing like pros.”
“Let the market work. You’re not its boss.”
💰Normal Tone Slogans:
“Enter with a plan, then let the trade play out.”
“The work is in the setup — the result comes with patience.”
“We don’t babysit trades. We trust our edge.”
“Entry is action. Waiting is discipline.”
“After entry, emotion has no place — only patience.”
💰⚖️ What is Risk/Reward Ratio?
The Risk/Reward Ratio (R:R) compares how much you’re risking on a trade versus how much you aim to gain.
Formula:
🧮 Risk/Reward = (Potential Loss) / (Potential Profit)

💰📌 Example:
You enter a trade with:
Entry Price: 1.1000
Stop Loss: 1.0950 → 50 pip risk
Take Profit: 1.1100 → 100 pip reward
Risk/Reward = 50 / 100 = 1:2
You’re risking 1 to make 2.

💰✅ Why It Matters:
🔐 Protects your capital – you don’t need to win all trades to be profitable.
🧠 Brings discipline – forces you to plan every trade.
📈 Key for long-term success – even with 40% win rate, you can be profitable if your R:R is good.

💰🎯 Common R:R Targets:
1:2 (Risk 1 to make 2) – good minimum standard.
1:3 or more – preferred by many swing traders.
1:1 – breakeven level, not ideal unless win rate is high.

💰🧠 Pro Tip:
Always match your Stop Loss and Take Profit to:
Market structure (support/resistance)
Volatility (use ATR)
Strategy logic (e.g., trend following, pullbacks, etc.)
